

Answered step by step
Verified Expert Solution
Question
1 Approved Answer
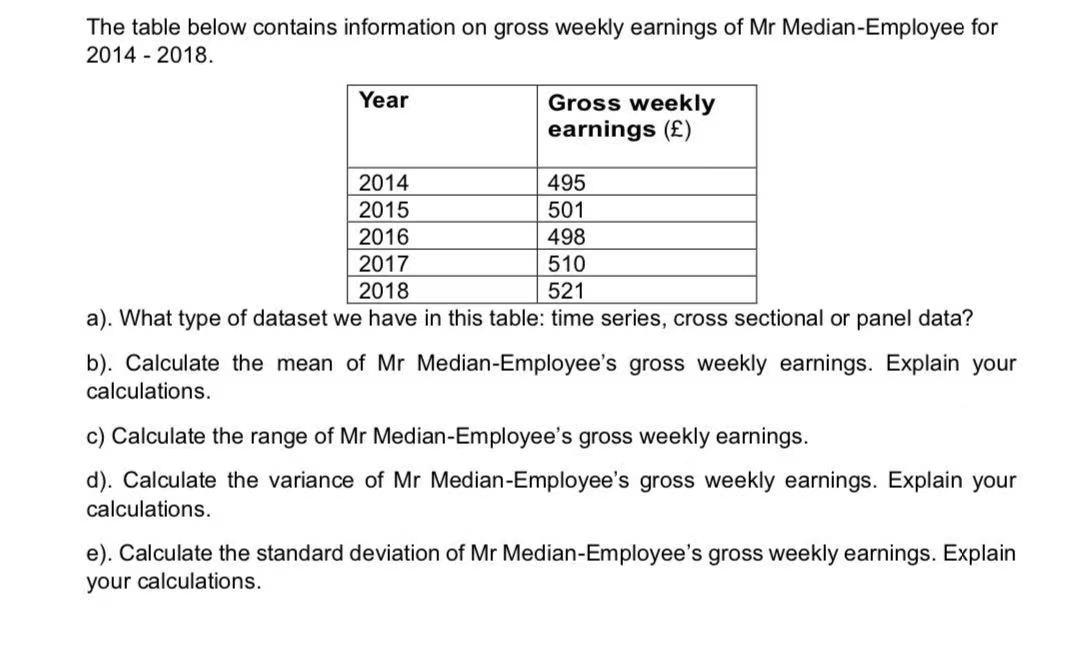
The table below contains information on gross weekly earnings of Mr Median-Employee for 2014 - 2018. Year Gross weekly earnings () 2014 495 2015 501
Step by Step Solution
There are 3 Steps involved in it
Step: 1

Get Instant Access to Expert-Tailored Solutions
See step-by-step solutions with expert insights and AI powered tools for academic success
Step: 2

Step: 3
Ace Your Homework with AI
Get the answers you need in no time with our AI-driven, step-by-step assistance
Get Started
Passive Income A Guide To Building Passive Income Streams
Authors: Yun Jin Xu
1st Edition
979-8866884490