

Answered step by step
Verified Expert Solution
Question
1 Approved Answer
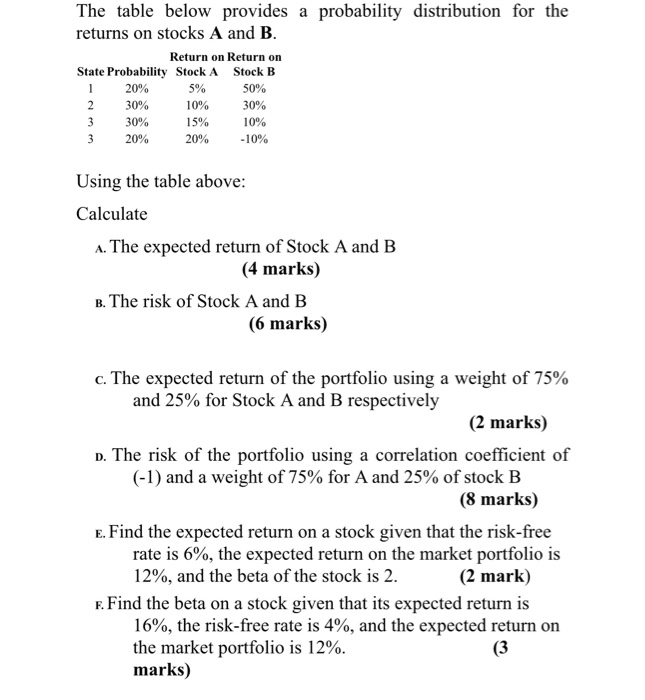
The table below provides a probability distribution for the returns on stocks A and B. Return on Return on State Probability Stock A Stock B
Step by Step Solution
There are 3 Steps involved in it
Step: 1

Get Instant Access to Expert-Tailored Solutions
See step-by-step solutions with expert insights and AI powered tools for academic success
Step: 2

Step: 3
Ace Your Homework with AI
Get the answers you need in no time with our AI-driven, step-by-step assistance
Get Started
Finance And Economics Discussion Series Tax Exhaustion Firm Investment And Leasing A Test Of The Q Model Of Investment
Authors: United States Federal Reserve Board, Michael P. O'Malley
1st Edition
1288722370, 9781288722372