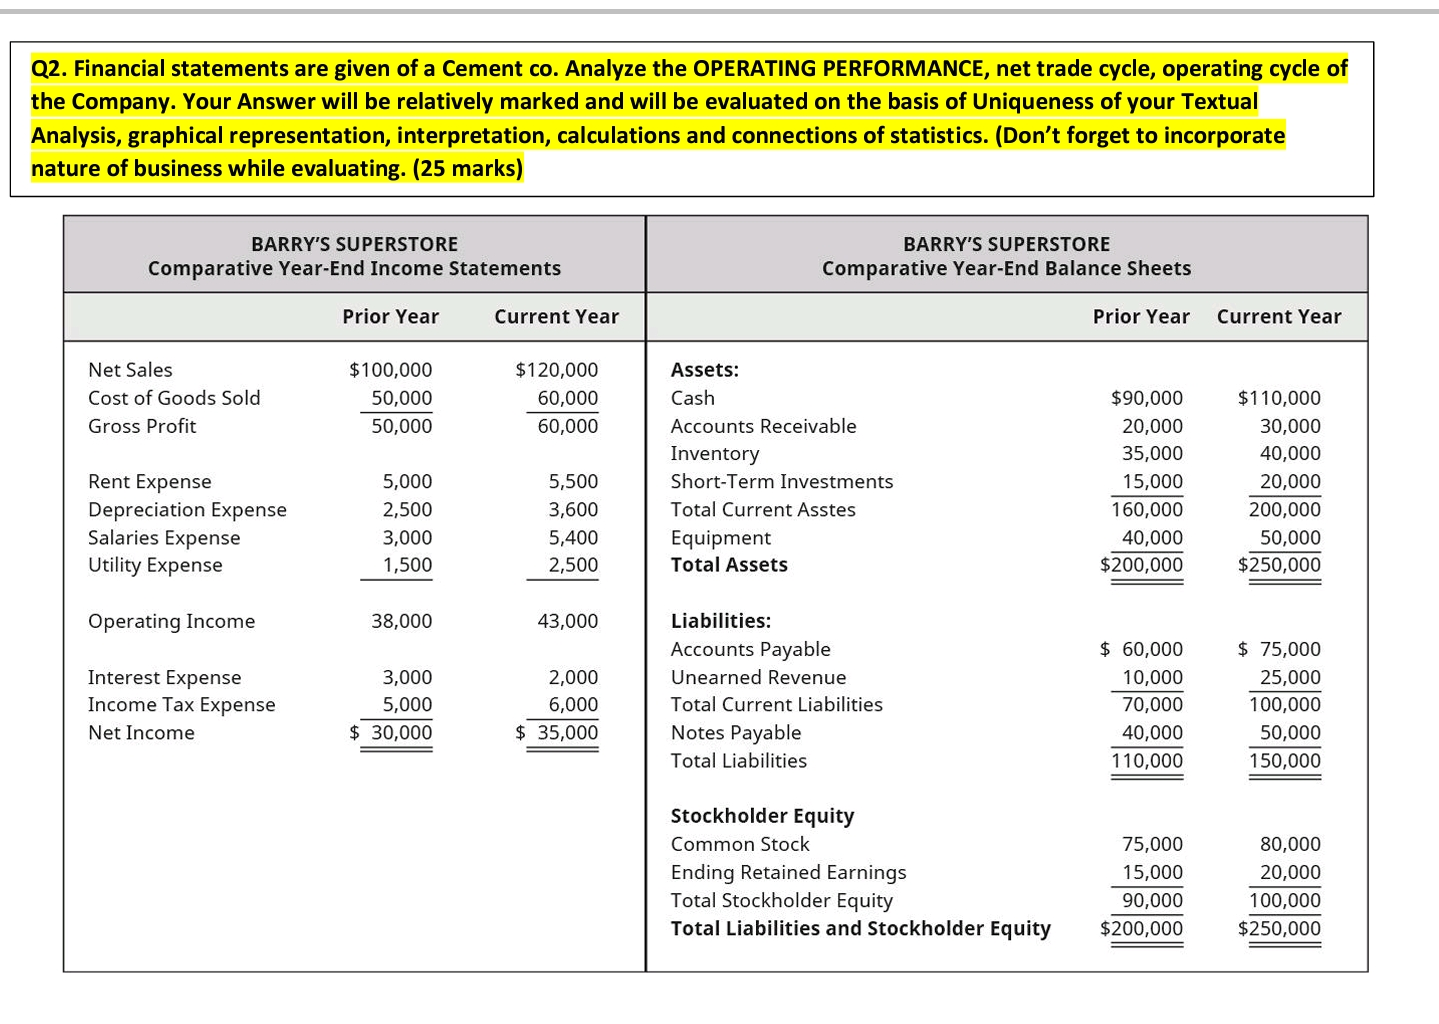
Q2. Financial statements are given of a Cement co. Analyze the OPERATING PERFORMANCE, net trade cycle, operating cycle of the Company. Your Answer will be relatively marked and will be evaluated on the basis of Uniqueness of your Textual Analysis, graphical representation, interpretation, calculations and connections of statistics. (Don't forget to incorporate nature of business while evaluating. (25 marks) BARRY'S SUPERSTORE Comparative Year-End Income Statements BARRY'S SUPERSTORE Comparative Year-End Balance Sheets Prior Year Current Year Prior Year Current Year Net Sales Cost of Goods Sold Gross Profit $100,000 50,000 50,000 $120,000 60,000 60,000 Assets: Cash Accounts Receivable Inventory Short-Term Investments Total Current Asstes Equipment Total Assets Rent Expense Depreciation Expense Salaries Expense Utility Expense 5,000 2,500 3,000 1,500 5,500 3,600 5,400 2,500 $90,000 20,000 35,000 15,000 160,000 40,000 $200,000 $110,000 30,000 40,000 20,000 200,000 50,000 $250,000 Operating Income 38,000 43,000 Interest Expense Income Tax Expense Net Income 3,000 5,000 $ 30,000 2,000 6,000 $ 35,000 Liabilities: Accounts Payable Unearned Revenue Total Current Liabilities Notes Payable Total Liabilities $ 60,000 10,000 70,000 40,000 110,000 $ 75,000 25,000 100,000 50,000 150,000 Stockholder Equity Common Stock Ending Retained Earnings Total Stockholder Equity Total Liabilities and Stockholder Equity 75,000 15,000 90,000 $200,000 80,000 20,000 100,000 $250,000 Q2. Financial statements are given of a Cement co. Analyze the OPERATING PERFORMANCE, net trade cycle, operating cycle of the Company. Your Answer will be relatively marked and will be evaluated on the basis of Uniqueness of your Textual Analysis, graphical representation, interpretation, calculations and connections of statistics. (Don't forget to incorporate nature of business while evaluating. (25 marks) BARRY'S SUPERSTORE Comparative Year-End Income Statements BARRY'S SUPERSTORE Comparative Year-End Balance Sheets Prior Year Current Year Prior Year Current Year Net Sales Cost of Goods Sold Gross Profit $100,000 50,000 50,000 $120,000 60,000 60,000 Assets: Cash Accounts Receivable Inventory Short-Term Investments Total Current Asstes Equipment Total Assets Rent Expense Depreciation Expense Salaries Expense Utility Expense 5,000 2,500 3,000 1,500 5,500 3,600 5,400 2,500 $90,000 20,000 35,000 15,000 160,000 40,000 $200,000 $110,000 30,000 40,000 20,000 200,000 50,000 $250,000 Operating Income 38,000 43,000 Interest Expense Income Tax Expense Net Income 3,000 5,000 $ 30,000 2,000 6,000 $ 35,000 Liabilities: Accounts Payable Unearned Revenue Total Current Liabilities Notes Payable Total Liabilities $ 60,000 10,000 70,000 40,000 110,000 $ 75,000 25,000 100,000 50,000 150,000 Stockholder Equity Common Stock Ending Retained Earnings Total Stockholder Equity Total Liabilities and Stockholder Equity 75,000 15,000 90,000 $200,000 80,000 20,000 100,000 $250,000