Answered step by step
Verified Expert Solution
Question
1 Approved Answer
The U.S. government's Bureau of Labor Statistics periodically makes studies of family budgets and uses the results to compile the consumer price index. These


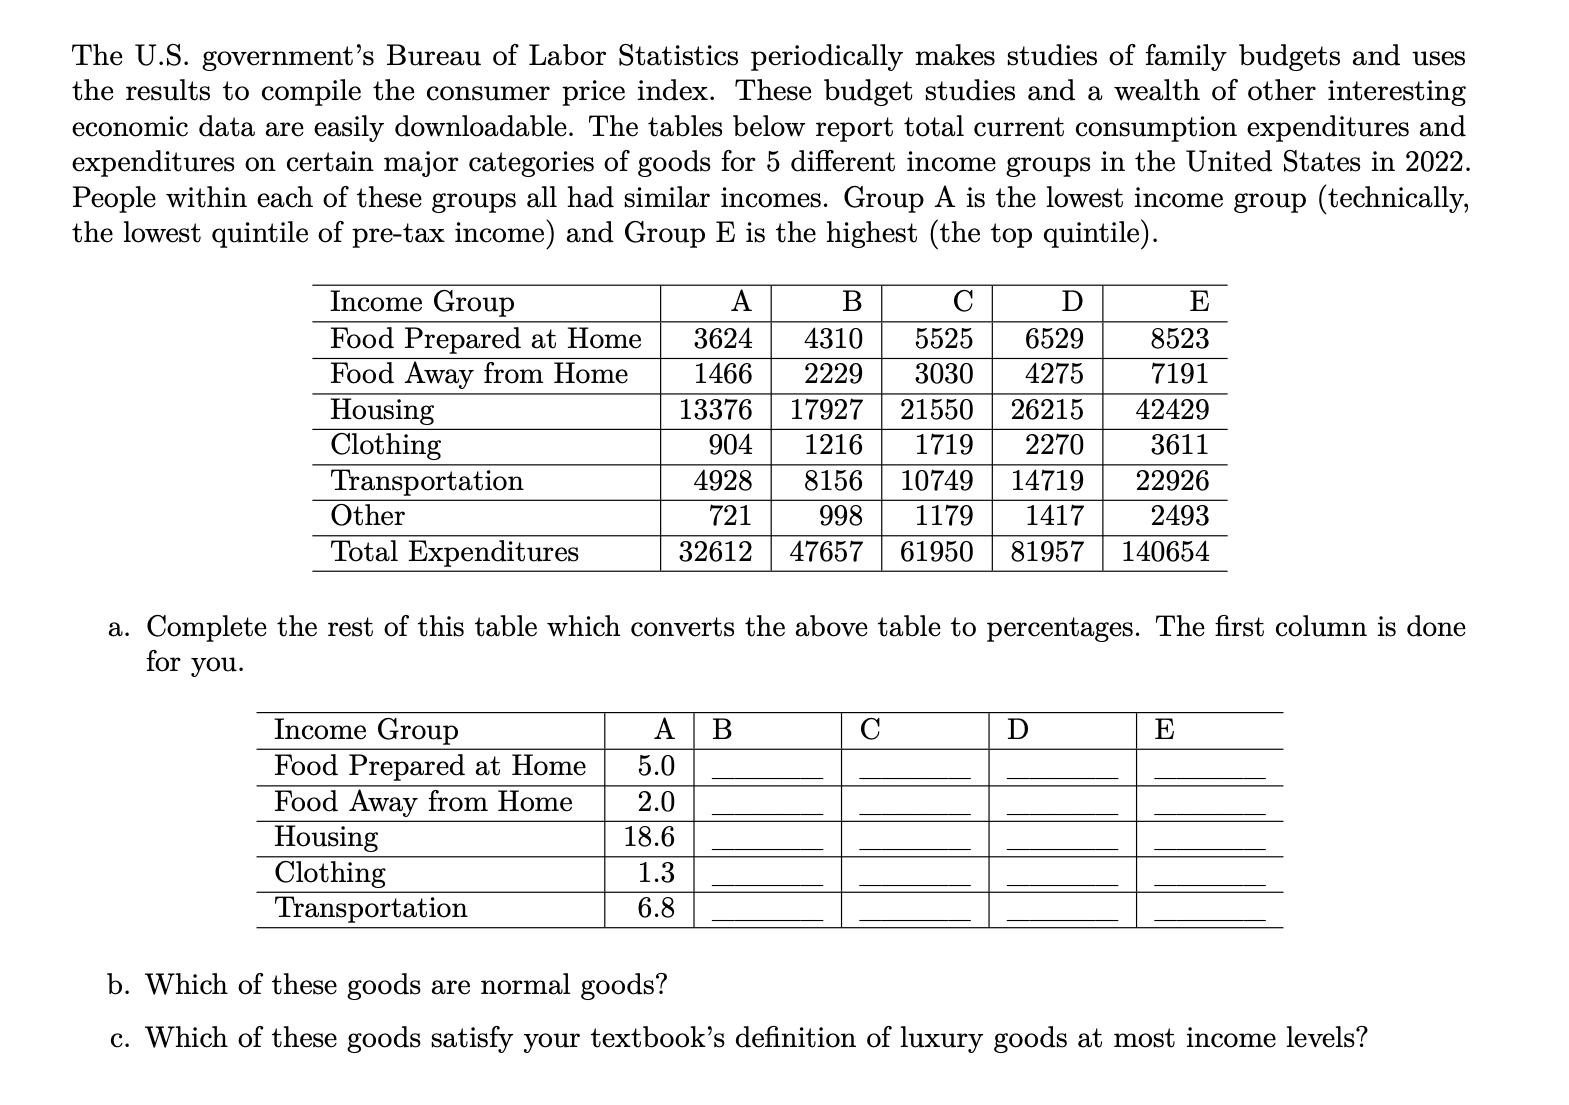
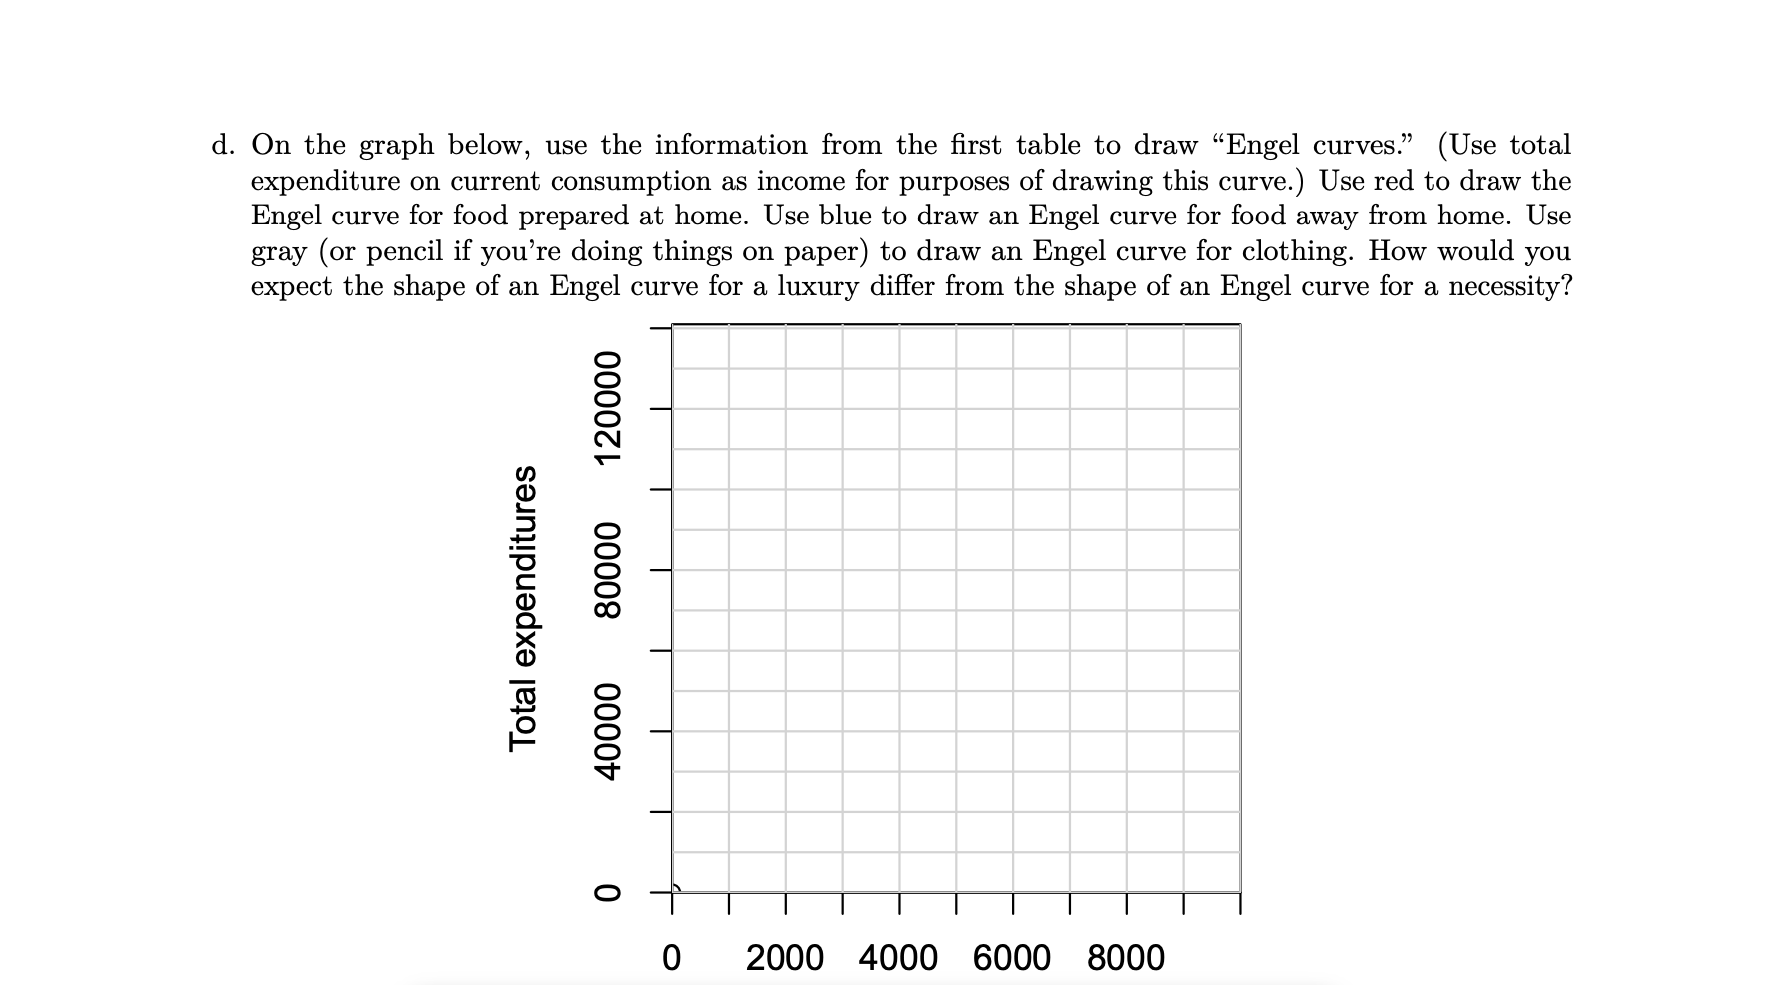
The U.S. government's Bureau of Labor Statistics periodically makes studies of family budgets and uses the results to compile the consumer price index. These budget studies and a wealth of other interesting economic data are easily downloadable. The tables below report total current consumption expenditures and expenditures on certain major categories of goods for 5 different income groups in the United States in 2022. People within each of these groups all had similar incomes. Group A is the lowest income group (technically, the lowest quintile of pre-tax income) and Group E is the highest (the top quintile). Income Group A B C D E Food Prepared at Home 3624 4310 5525 6529 8523 Food Away from Home 1466 2229 3030 4275 7191 Housing 13376 17927 21550 26215 42429 Clothing 904 1216 1719 2270 3611 Transportation 4928 Other Total Expenditures 721 32612 8156 10749 998 1179 1417 47657 61950 81957 140654 14719 22926 2493 a. Complete the rest of this table which converts the above table to percentages. The first column is done for you. Income Group Food Prepared at Home A B 5.0 C D E Food Away from Home 2.0 Housing 18.6 Clothing 1.3 6.8 Transportation b. Which of these goods are normal goods? c. Which of these goods satisfy your textbook's definition of luxury goods at most income levels? d. On the graph below, use the information from the first table to draw "Engel curves." (Use total expenditure on current consumption as income for purposes of drawing this curve.) Use red to draw the Engel curve for food prepared at home. Use blue to draw an Engel curve for food away from home. Use gray (or pencil if you're doing things on paper) to draw an Engel curve for clothing. How would you expect the shape of an Engel curve for a luxury differ from the shape of an Engel curve for a necessity? Total expenditures 0 40000 80000 120000 0 2000 4000 6000 8000
Step by Step Solution
There are 3 Steps involved in it
Step: 1

Get Instant Access to Expert-Tailored Solutions
See step-by-step solutions with expert insights and AI powered tools for academic success
Step: 2

Step: 3

Ace Your Homework with AI
Get the answers you need in no time with our AI-driven, step-by-step assistance
Get Started


