

Answered step by step
Verified Expert Solution
Question
1 Approved Answer
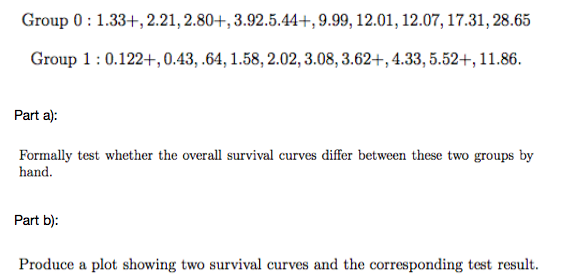
This is a survival analysis question. The numbers below represent the survival times in years for two groups with a rare disease. The values with
This is a survival analysis question. The numbers below represent the survival times in years for two groups with a rare disease. The values with (+) are censored.
Step by Step Solution
There are 3 Steps involved in it
Step: 1

Get Instant Access to Expert-Tailored Solutions
See step-by-step solutions with expert insights and AI powered tools for academic success
Step: 2

Step: 3
Ace Your Homework with AI
Get the answers you need in no time with our AI-driven, step-by-step assistance
Get Started
Applied Calculus
Authors: Stefan Waner, Steven Costenoble
6th Edition
1285415310, 9781285415314