Answered step by step
Verified Expert Solution
Link Copied!

Question

1 Approved Answer

THIS IS FOR THE RESULTS SECTION OF MY STUDY: I AM MEASURING WAITING TIME WITH THE GOAL OF REDUCING WAIT TIME IN AN OUTPATIENT DEPT

THIS IS FOR THE RESULTS SECTION OF MY STUDY:

I AM MEASURING WAITING TIME WITH THE GOAL OF REDUCING WAIT TIME IN AN OUTPATIENT DEPT OF A HOSPITAL. 2 SEPARATE DATA SETS WERE DONE - BEFORE THE IMPLEMENTATION OF LEAN METHODOLOGY AND AFTER THE IMPLEMENTATION OF LEAN. I AM TRYING TO IMPROVE THE HOSPITAL APPOINTMENT PROCESSES BY IMPLEMENTING LEAN METHODOLOGY (I.E. - VALUE STREAM MAP, ROOT CAUSE ANALYSIS, PATIENT SCHEDULING AND QUEUE SYSTEM).

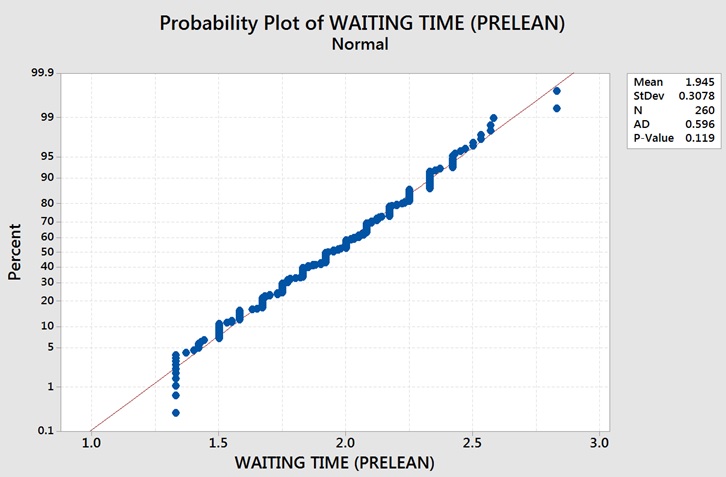
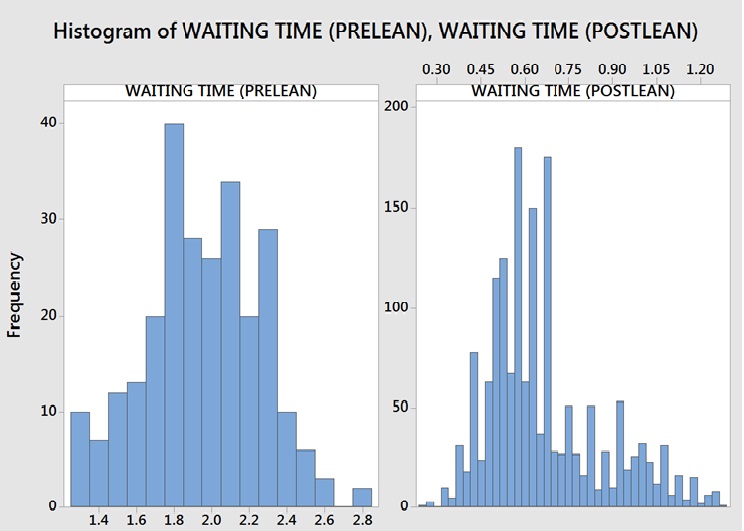
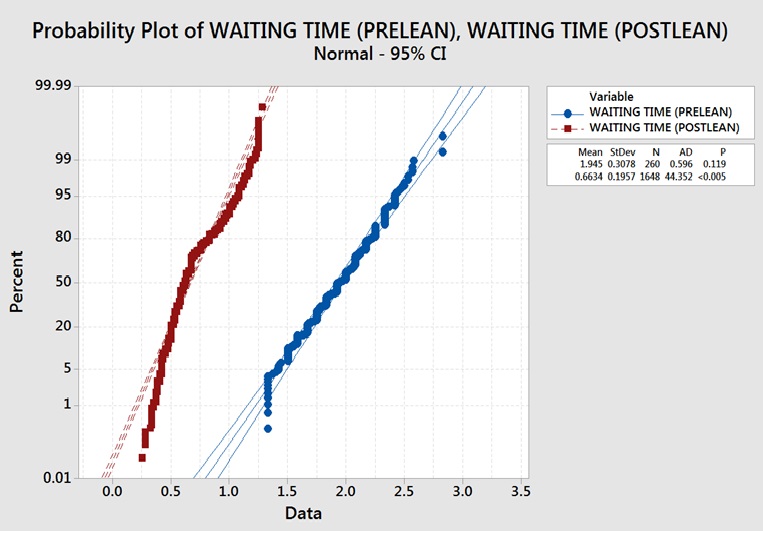
I NEEDED TO DETERMINE NORMALITY.....OR NORMAL DISTRIBUTION IN THE STUDY

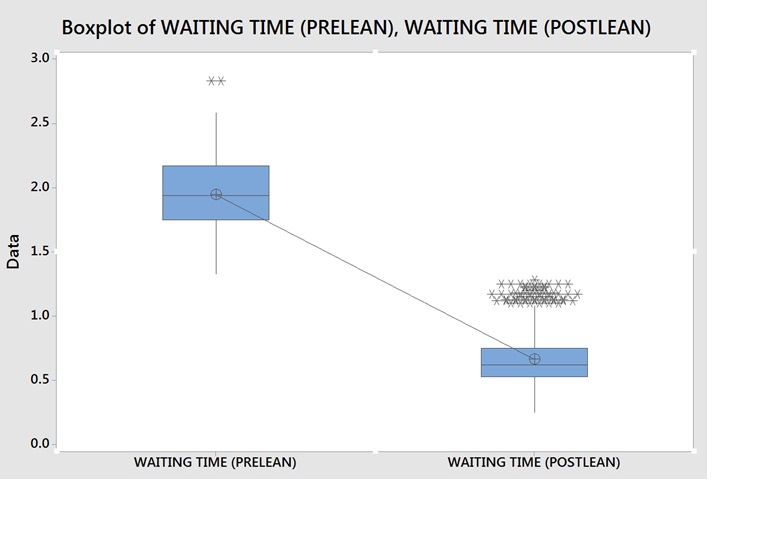
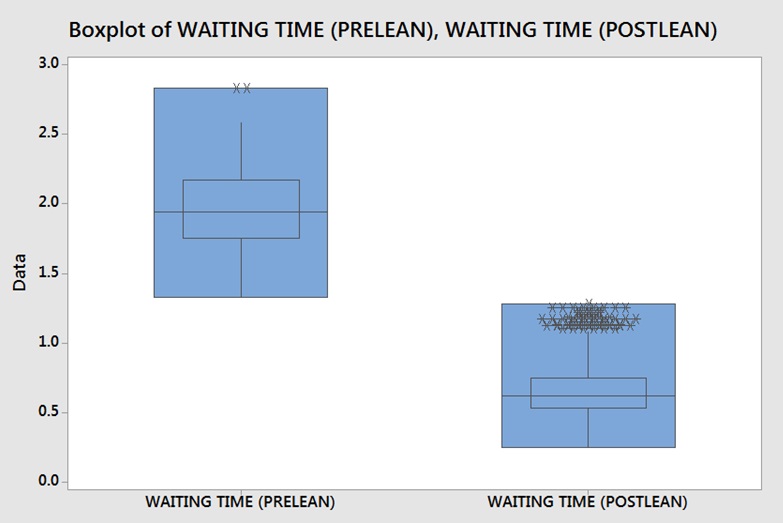
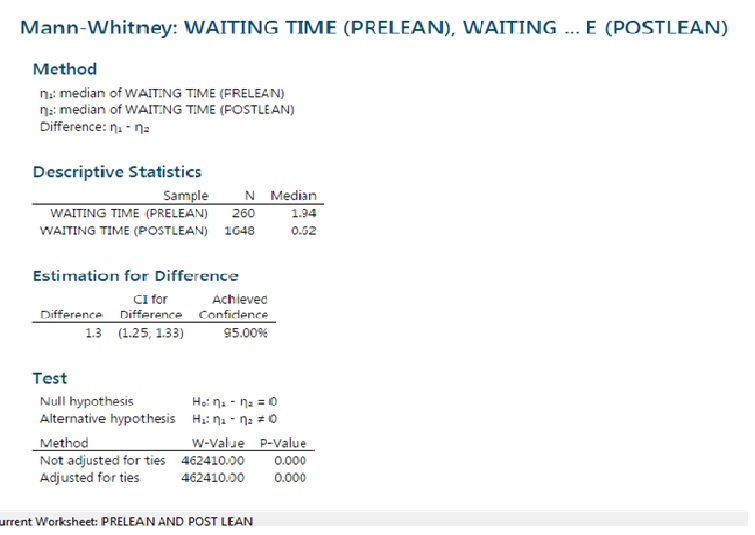
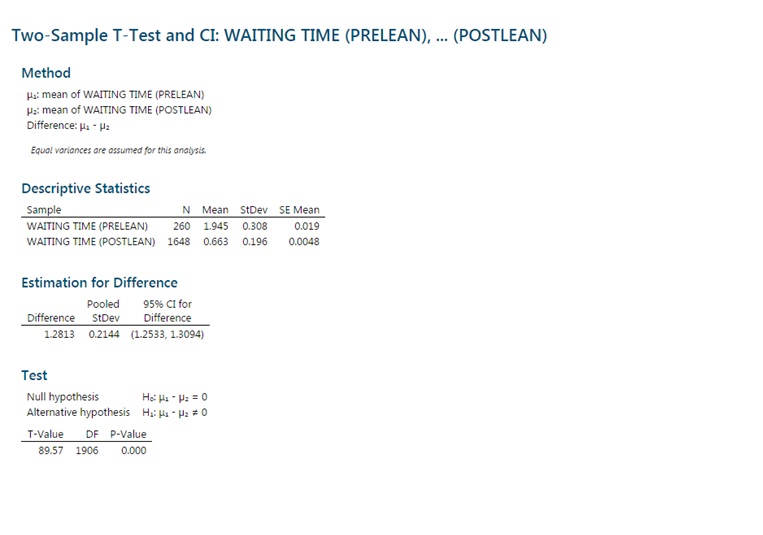
NEED HELP IN INTERPRETING THE ATTACHED CHARTS.....I RAN AN ANDERSON-DARLING PARAMETRIC TEST......ALSO RAN A MANN-WHITNEY NON-PARAMETRIC TEST.....ALSO RAN A 2-SAMPLE T-TEST. AM I CORRECT TO DO THESE?

ALSO - When do we need to find out about determining whether data sets are normally distributed?at what point in the study should this be done? And why do we need to find this out?If we run a mann-whitney test, can we also run a 2-sample t test?I am trying to measure waiting time with 2 separate data sets - one set before the implementation of Lean methodology, and the other set after the implementation of Lean.Please advise.

CHARTS ARE ATTACHED:

THANKS FOR YOUR KINDNESS! YOU FOLKS ARE THE BEST! NUMBER ONE IN THE WORLD!!
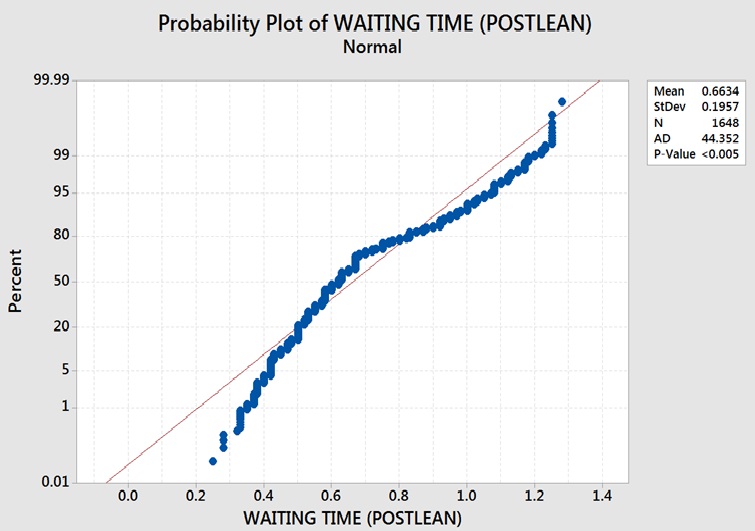
image text in transcribedimage text in transcribedimage text in transcribedimage text in transcribedimage text in transcribedimage text in transcribedimage text in transcribedimage text in transcribed
\f\f\f\f\fMann-Whitney: WAITING TIME (PRELEAN), WAITING ... E (POSTLEAN) Method n: median of WAITING TIME (FRELEAN) 1: median of WAITING TIME (POSTLEAN) Difference: m - n= Descriptive Statistics Sample N Median WAITING TIME (PRELEAN) 260 1.94 WAITING TIME (POSTLEAN) 1648 0.62 Estimation for Difference CI for Achieved Difference Difference Confidence 1.3 (1.25, 1.33) 95.00% Test Null hypothesis Hai na - n:=0 Alternative hypothesis Hiin - n:= 0 Method W-Value P-Value Not adjusted for ties 462410.00 0.000 Adjusted for ties 462410.50 0.000 urrent Worksheet: PRELEAN AND POST LEAN\fTwo-Sample T-Test and CI: WAITING TIME (PRELEAN), ... (POSTLEAN) Method Hi mean of WAITING TIME (PRELEAN) He mean of WAITING TIME (POSTLEAN) Difference: Ha - We Equal variances are assumed for this analysis. Descriptive Statistics Sample N Mean StDev SE Mean WAITING TIME (PRELEAN) 260 1.945 0.308 0.019 WAITING TIME (POSTLEAN) 1648 0.663 0.196 0.0048 Estimation for Difference Pooled 95% CI for Difference StDev Difference 1 2813 0.2144 (1.2533, 1.3094) Test Null hypothesis He: Hi - P: = 0 Alternative hypothesis Hy: Hi - : = 0 T-Value DF P-Value 89.57 1906 0.000

Step by Step Solution

There are 3 Steps involved in it

Step: 1

blur-text-image

Get Instant Access to Expert-Tailored Solutions

See step-by-step solutions with expert insights and AI powered tools for academic success

Step: 2

blur-text-image

Step: 3

blur-text-image

Ace Your Homework with AI

Get the answers you need in no time with our AI-driven, step-by-step assistance

Get Started

Recommended Textbook for

Contemporary Business Mathematics With Canadian Applications

Authors: Ali R. Hassanlou, S. A. Hummelbrunner, Kelly Halliday

12th Edition

0135285011, 978-0135285015

More Books

Students also viewed these Mathematics questions