This is statistics course and I need help with answering those questions. If you don't have much time to provide solutions, that's fine but I need correct answers asap. Thank you
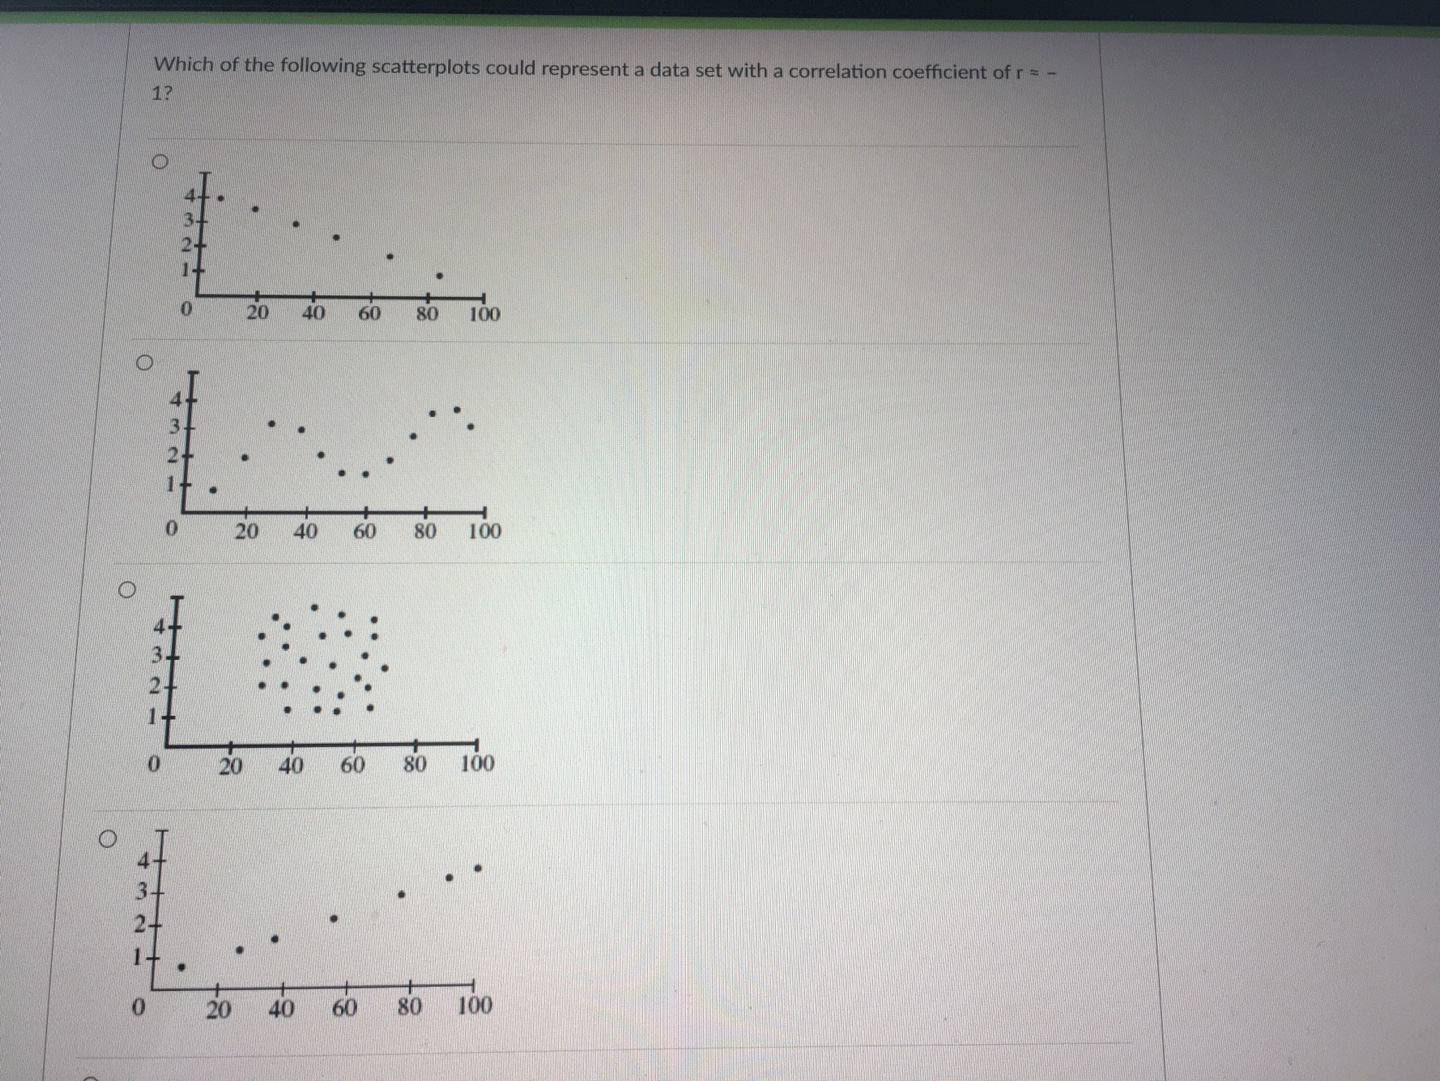
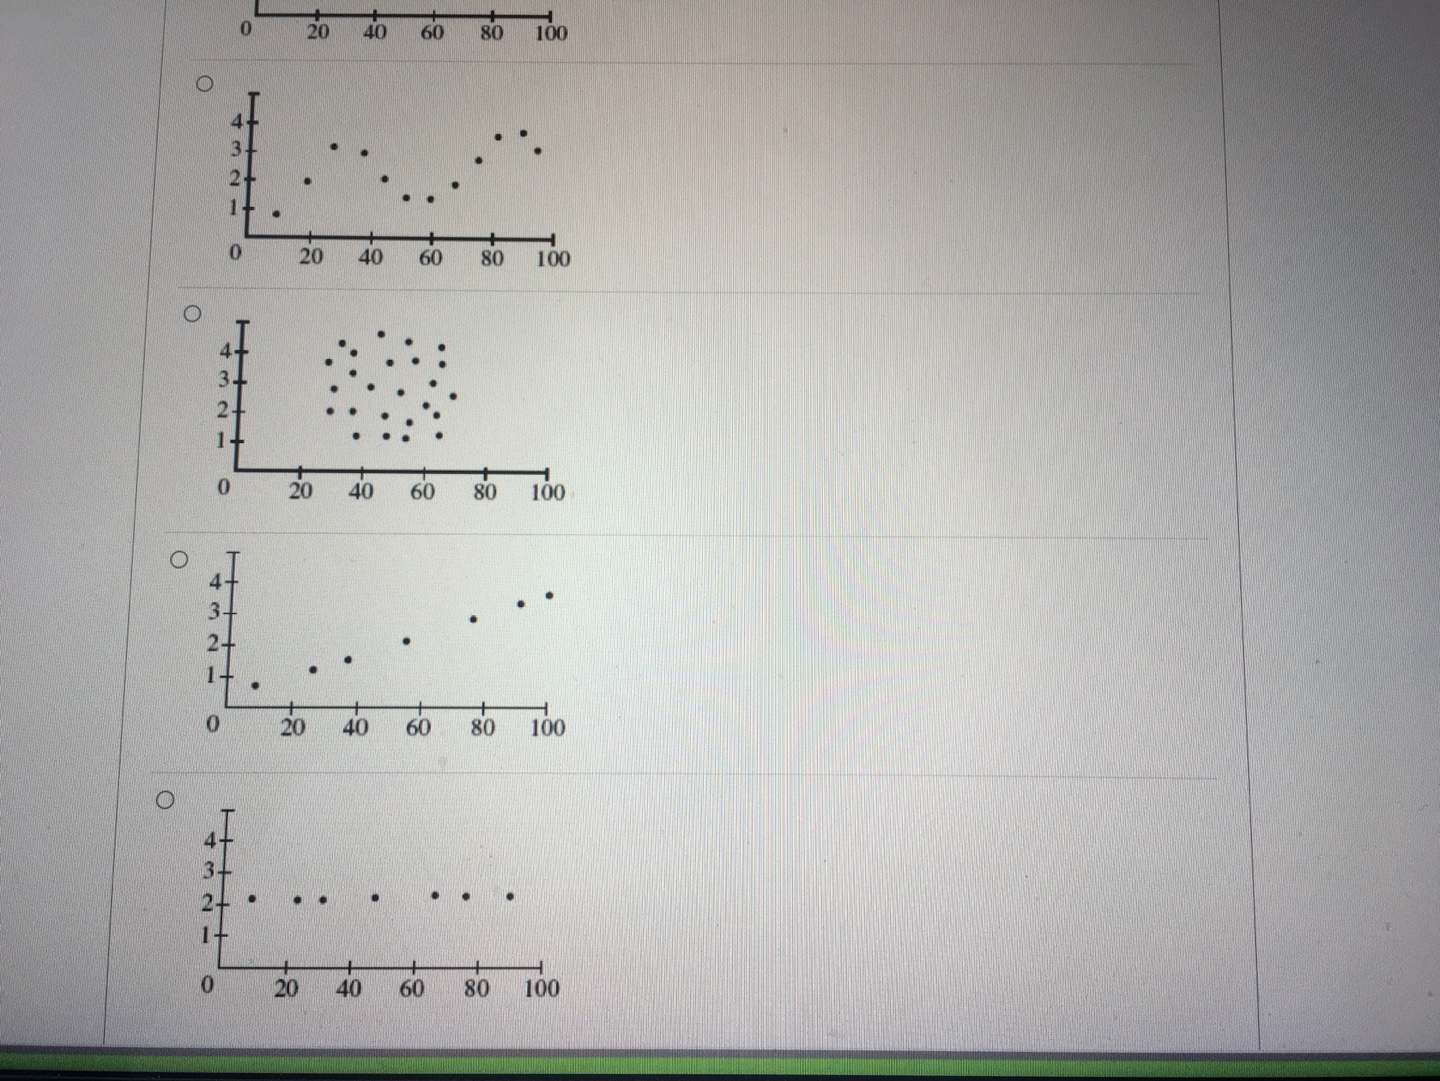
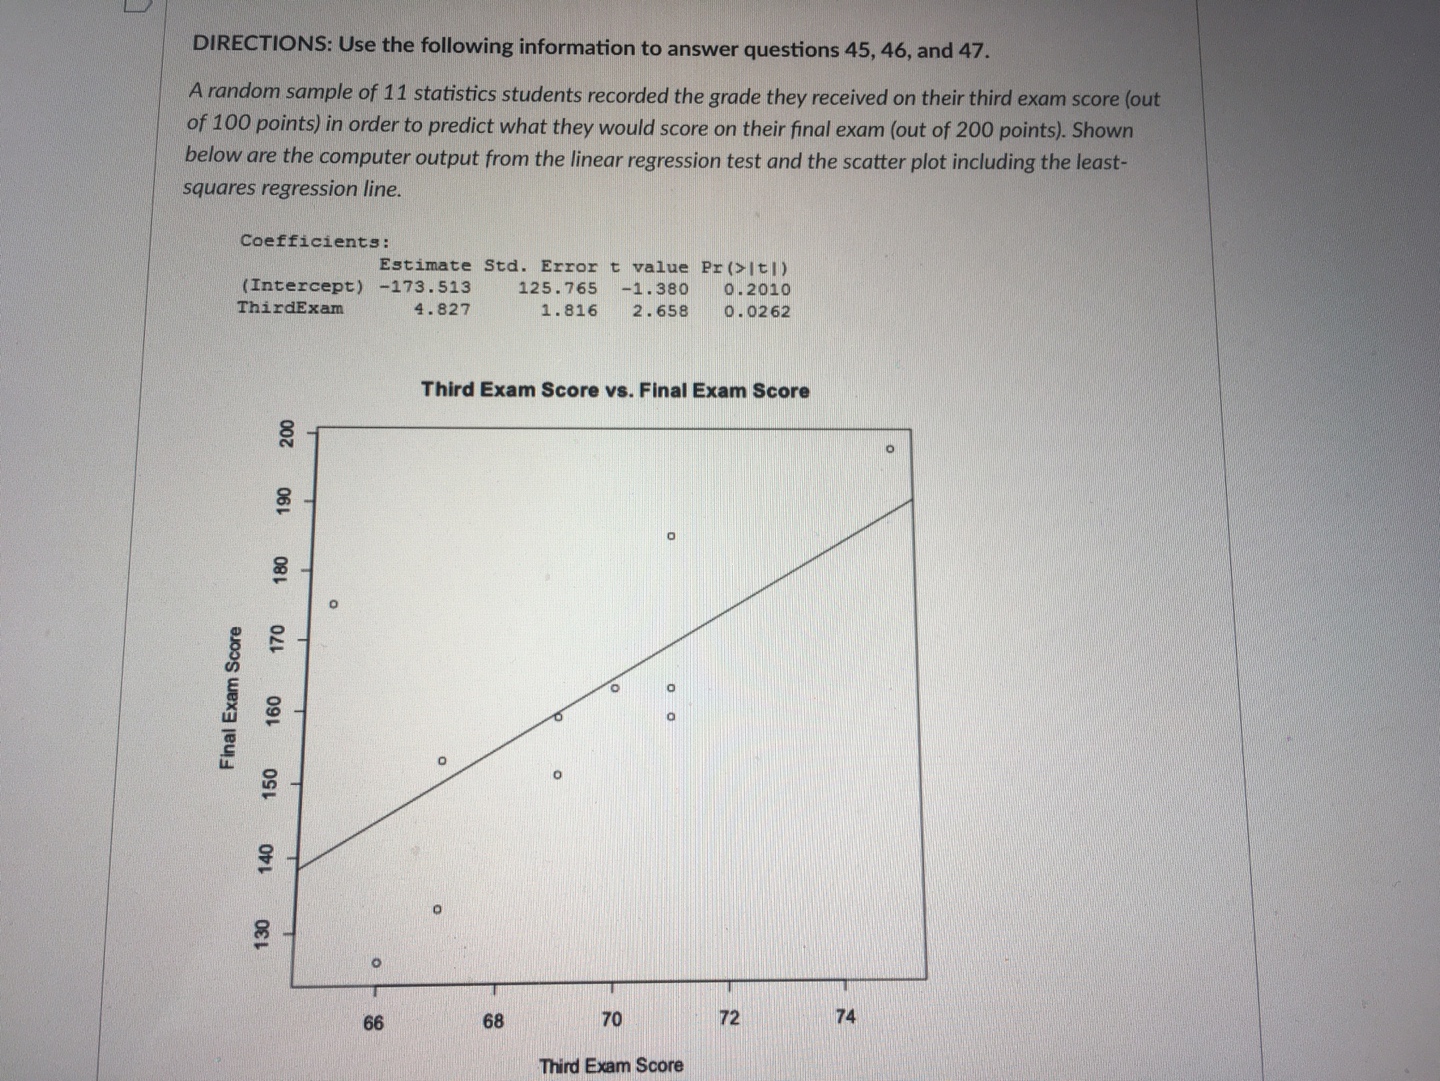
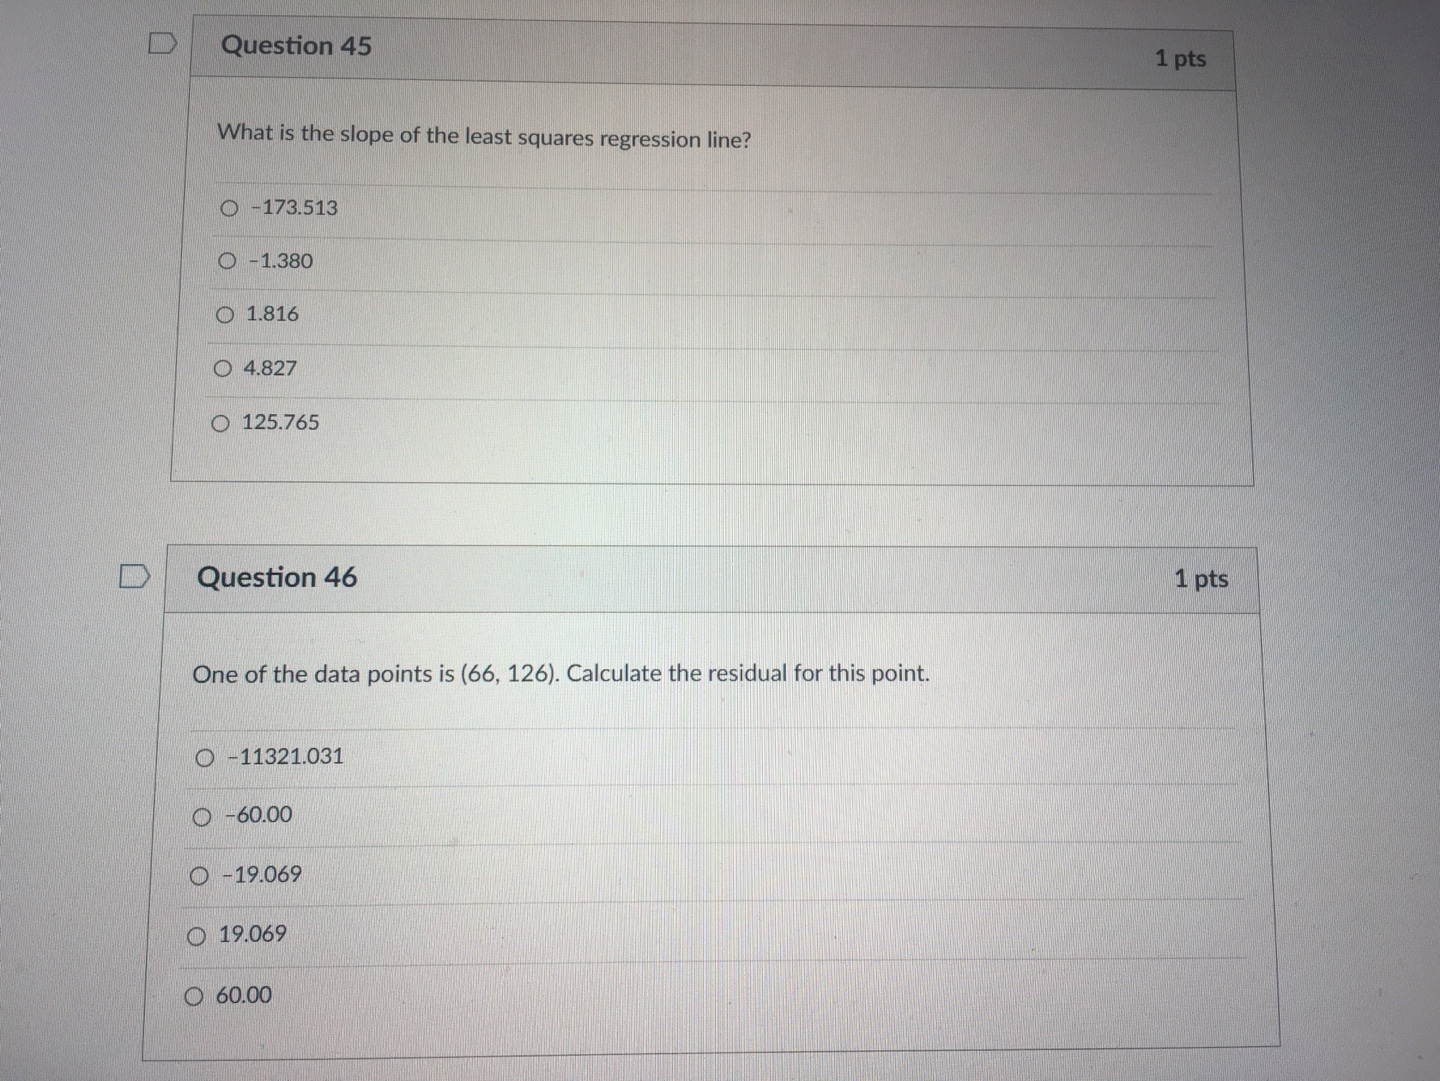
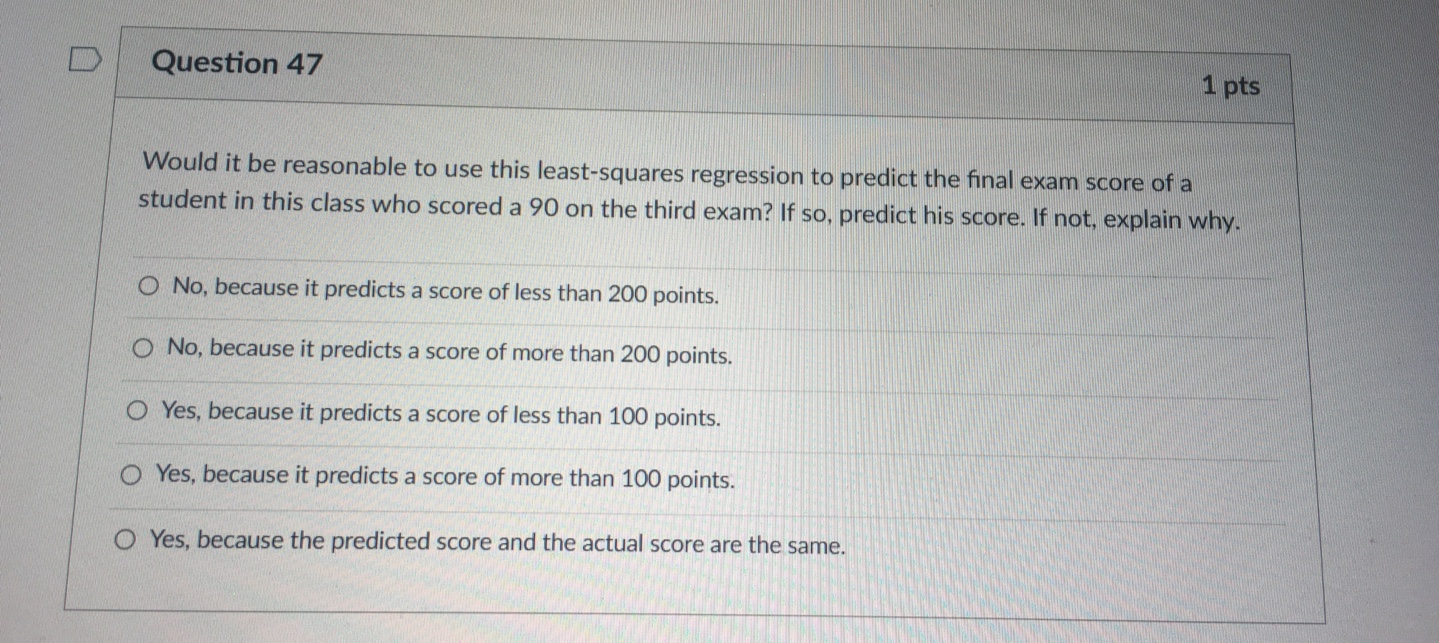
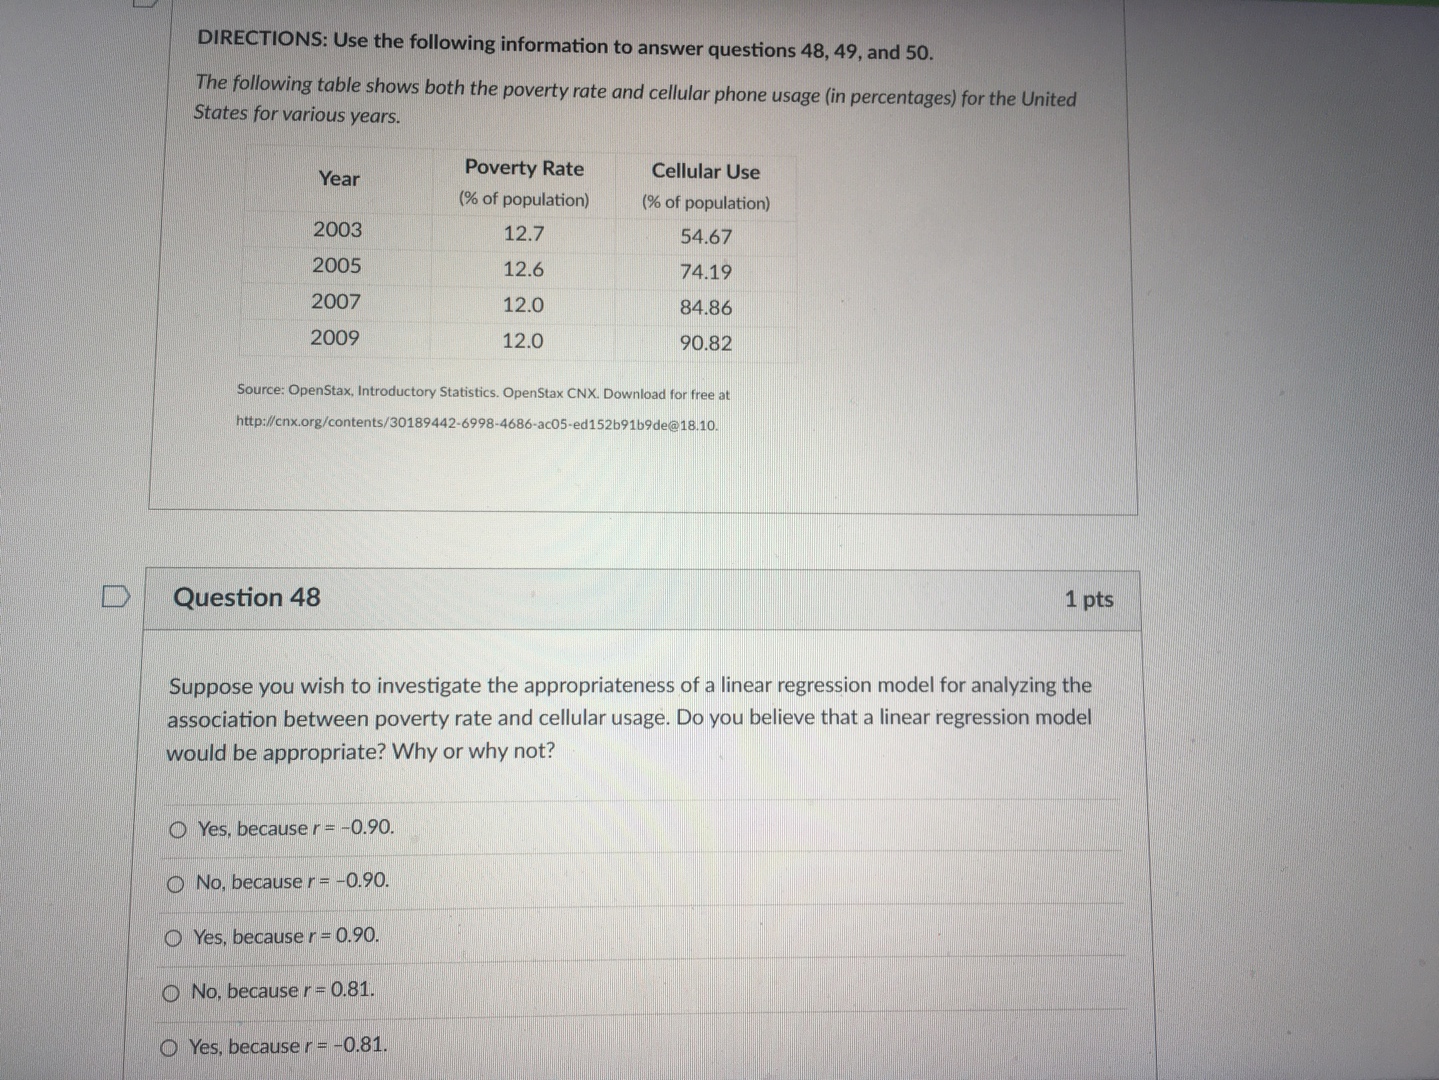
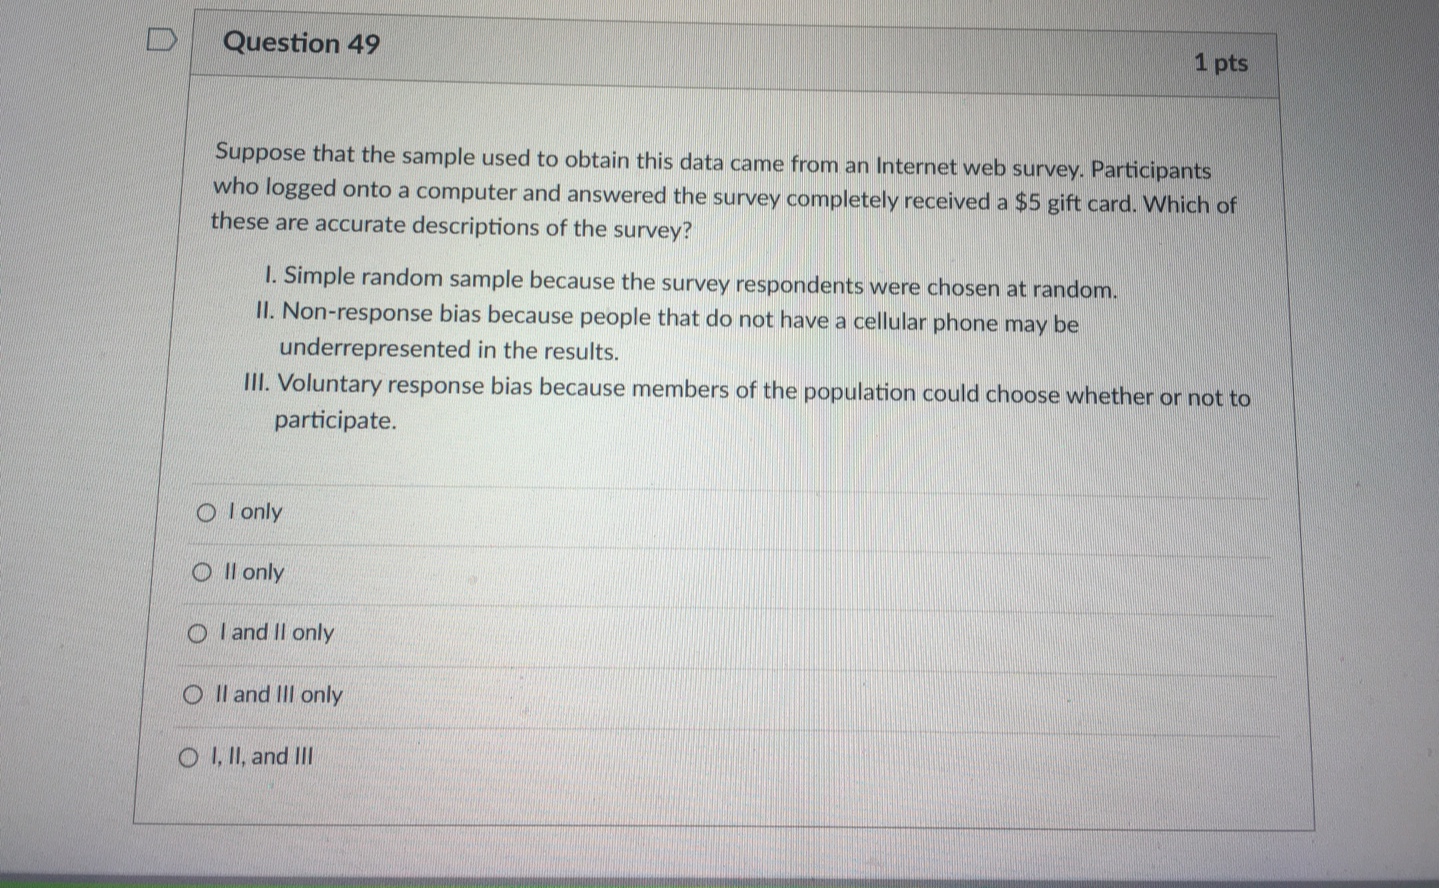
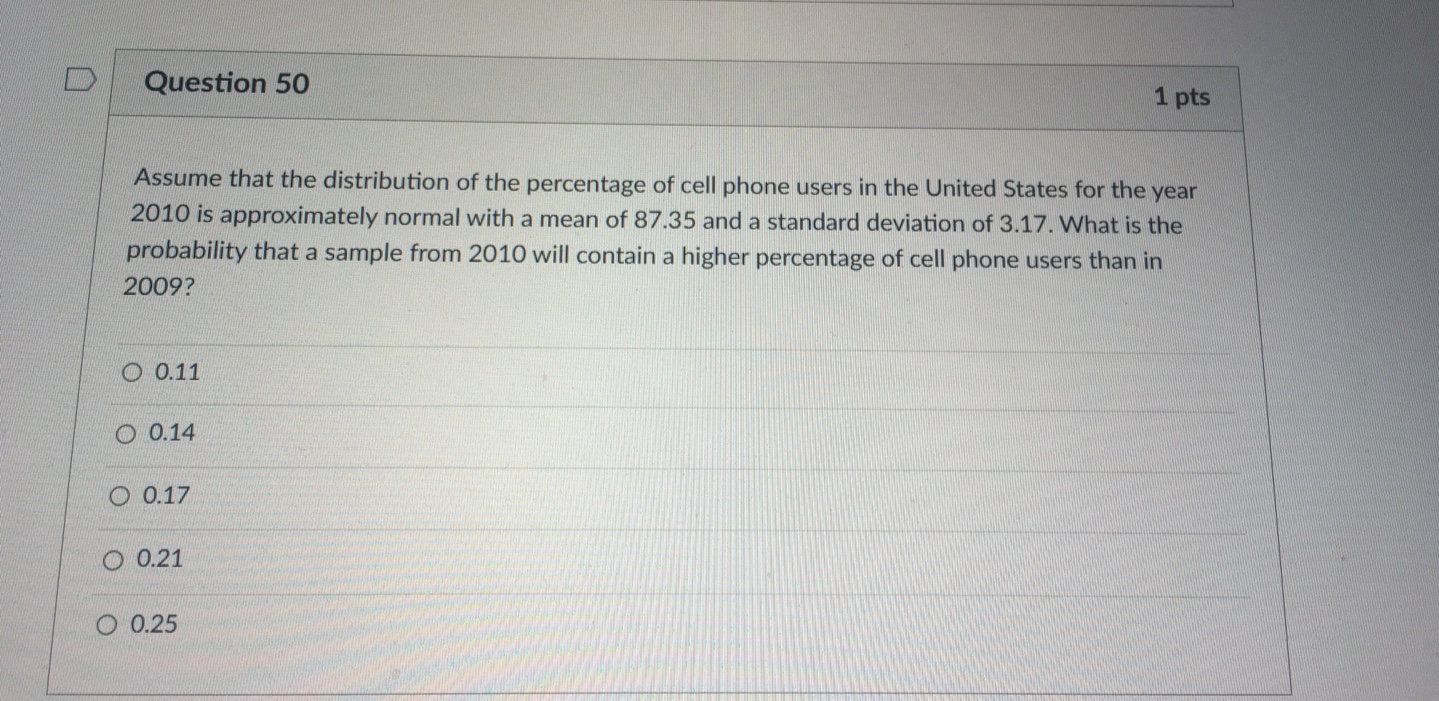
Which of the following scatterplots could represent a data set with a correlation coefficient of r = - 1? O 20 40 60 80 100 O NOW O 20 40 60 80 100 O O 20 40 60 80 100 O 20 40 60 80 10020 60 80 100 O -NWA 0 20 40 60 0 100 O TNW O 20 40 60 80 100 O NWA O 20 40 60 80 100 O . . 0 20 40 60 80 100DIRECTIONS: Use the following information to answer questions 45, 46, and 47. A random sample of 11 statistics students recorded the grade they received on their third exam score (out of 100 points) in order to predict what they would score on their final exam (out of 200 points). Shown below are the computer output from the linear regression test and the scatter plot including the least- squares regression line. Coefficients : Estimate Std. Error t value Pr (>|t| ) (Intercept) -173 . 513 125 . 765 -1 . 380 0 . 2010 ThirdExam 4. 827 1. 816 2 . 658 0 . 0262 Third Exam Score vs. Final Exam Score 200 190 180 160 170 O Final Exam Score 140 150 130 66 68 70 72 74 Third Exam ScoreQuestion 45 1 pts What is the slope of the least squares regression line? O -173.513 O -1.380 1.816 O 4.827 125.765 D Question 46 1 pts One of the data points is (66, 126). Calculate the residual for this point. O -11321.031 -60.00 -19.069 19.069 60.00Question 47 1 pts Would it be reasonable to use this least-squares regression to predict the final exam score of a student in this class who scored a 90 on the third exam? If so, predict his score. If not, explain why. No, because it predicts a score of less than 200 points. No, because it predicts a score of more than 200 points. Yes, because it predicts a score of less than 100 points. Yes, because it predicts a score of more than 100 points. Yes, because the predicted score and the actual score are the same.DIRECTIONS: Use the following information to answer questions 48, 49, and 50. The following table shows both the poverty rate and cellular phone usage (in percentages) for the United States for various years. Year Poverty Rate Cellular Use (% of population) (% of population) 2003 12.7 54.67 2005 12.6 74.19 2007 12.0 84.86 2009 12.0 90.82 Source: OpenStax, Introductory Statistics. OpenStax CNX. Download for free at http://cnx.org/contents/30189442-6998-4686-ac05-ed152b91b9de@18.10 D Question 48 1 pts Suppose you wish to investigate the appropriateness of a linear regression model for analyzing the association between poverty rate and cellular usage. Do you believe that a linear regression model would be appropriate? Why or why not? Yes, because r = -0.90. No, because r = -0.90. Yes, because r = 0.90. No, because r = 0.81. Yes, because r = -0.81.D Question 49 1 pts Suppose that the sample used to obtain this data came from an Internet web survey. Participants who logged onto a computer and answered the survey completely received a $5 gift card. Which of these are accurate descriptions of the survey? I. Simple random sample because the survey respondents were chosen at random. II. Non-response bias because people that do not have a cellular phone may be underrepresented in the results. Ill. Voluntary response bias because members of the population could choose whether or not to participate. O I only O ll only I and II only O Il and Ill only O I, Il, and IllQuestion 50 1 pts Assume that the distribution of the percentage of cell phone users in the United States for the year 2010 is approximately normal with a mean of 87.35 and a standard deviation of 3.17. What is the probability that a sample from 2010 will contain a higher percentage of cell phone users than in 2009? O 0.11 O 0.14 O 0.17 O 0.21 O 0.25