Answered step by step
Verified Expert Solution
Question
1 Approved Answer
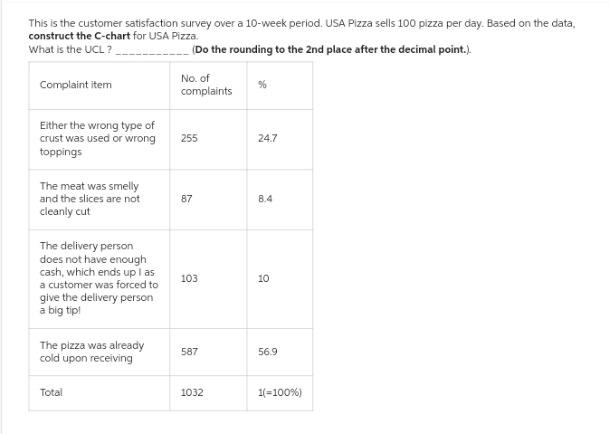
This is the customer satisfaction survey over a 10-week period. USA Pizza sells 100 pizza per day. Based on the data, construct the C-chart

This is the customer satisfaction survey over a 10-week period. USA Pizza sells 100 pizza per day. Based on the data, construct the C-chart for USA Pizza. (Do the rounding to the 2nd place after the decimal point.). What is the UCL? Complaint item No. of complaints % Either the wrong type of crust was used or wrong toppings The meat was smelly and the slices are not cleanly cut The delivery person does not have enough cash, which ends up I as a customer was forced to give the delivery person a big tip! 255 24.7 87 20 8.4 103 10 The pizza was already cold upon receiving 587 56.9 Total 1032 1(-100%)
Step by Step Solution
There are 3 Steps involved in it
Step: 1

Get Instant Access to Expert-Tailored Solutions
See step-by-step solutions with expert insights and AI powered tools for academic success
Step: 2

Step: 3

Ace Your Homework with AI
Get the answers you need in no time with our AI-driven, step-by-step assistance
Get Started


