

Question
tions | 1. The table on the right contains employment data for males and females between May 2020 and April 2021. The data is
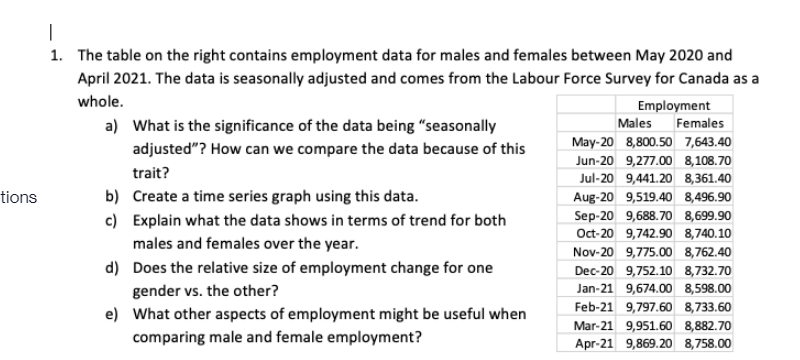
tions | 1. The table on the right contains employment data for males and females between May 2020 and April 2021. The data is seasonally adjusted and comes from the Labour Force Survey for Canada as a whole. a) What is the significance of the data being "seasonally adjusted"? How can we compare the data because of this trait? b) Create a time series graph using this data. c) Explain what the data shows in terms of trend for both males and females over the year. d) Does the relative size of employment change for one gender vs. the other? e) What other aspects of employment might be useful when comparing male and female employment? Employment Males Females May-20 8,800.50 7,643.40 Jun-20 9,277.00 8,108.70 Jul-20 9,441.20 8,361.40 Aug-20 9,519.40 8,496.90 Sep-20 9,688.70 8,699.90 Oct-20 9,742.90 8,740.10 Nov-20 9,775.00 8,762.40 Dec-20 9,752.10 8,732.70 Jan-21 9,674.00 8,598.00 Feb-21 9,797.60 8,733.60 Mar-21 9,951.60 8,882.70 Apr-21 9,869.20 8,758.00
Step by Step Solution
There are 3 Steps involved in it
Step: 1

Get Instant Access with AI-Powered Solutions
See step-by-step solutions with expert insights and AI powered tools for academic success
Step: 2

Step: 3
Ace Your Homework with AI
Get the answers you need in no time with our AI-driven, step-by-step assistance
Get Started
Applied Regression Analysis And Other Multivariable Methods
Authors: David G. Kleinbaum, Lawrence L. Kupper, Azhar Nizam, Eli S. Rosenberg
5th Edition
1285051084, 978-1285963754, 128596375X, 978-1285051086