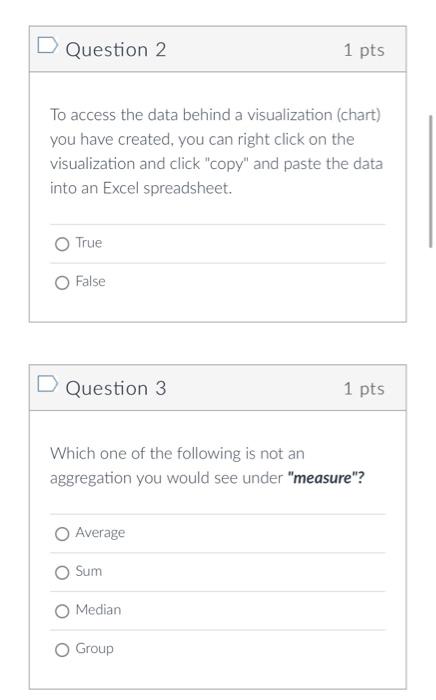
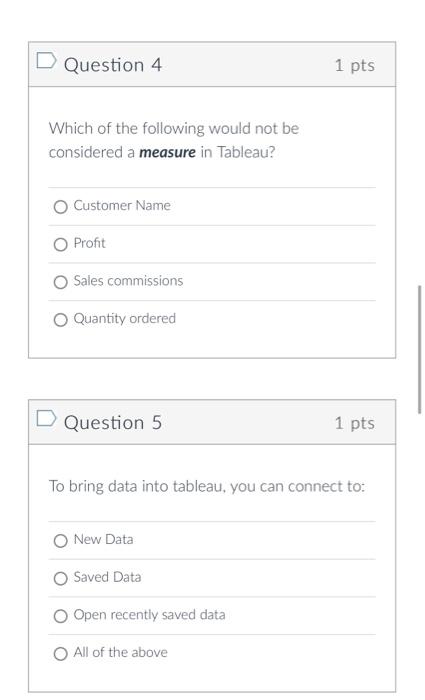
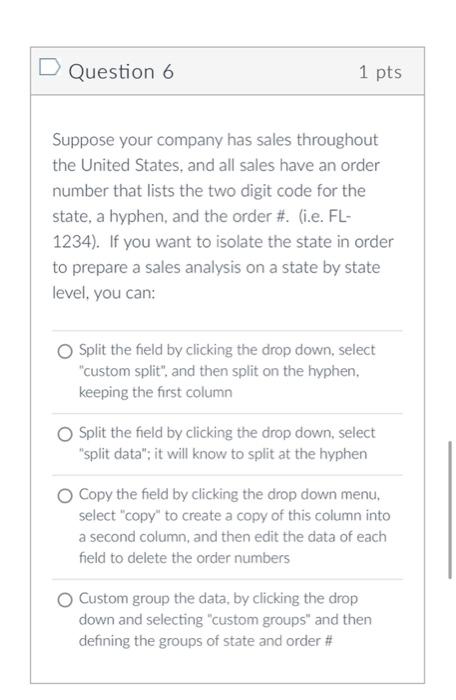
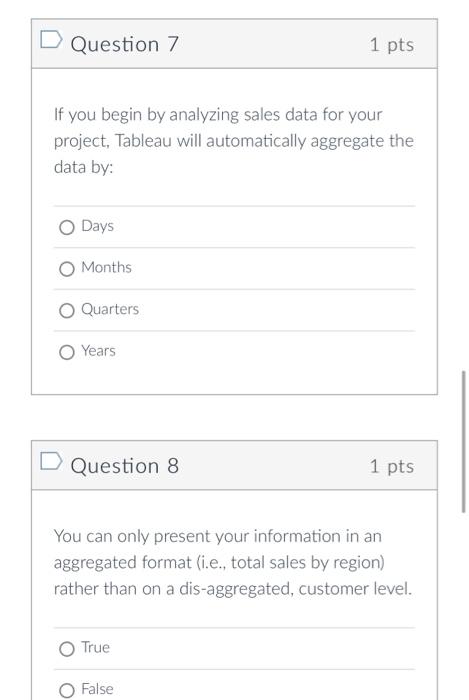
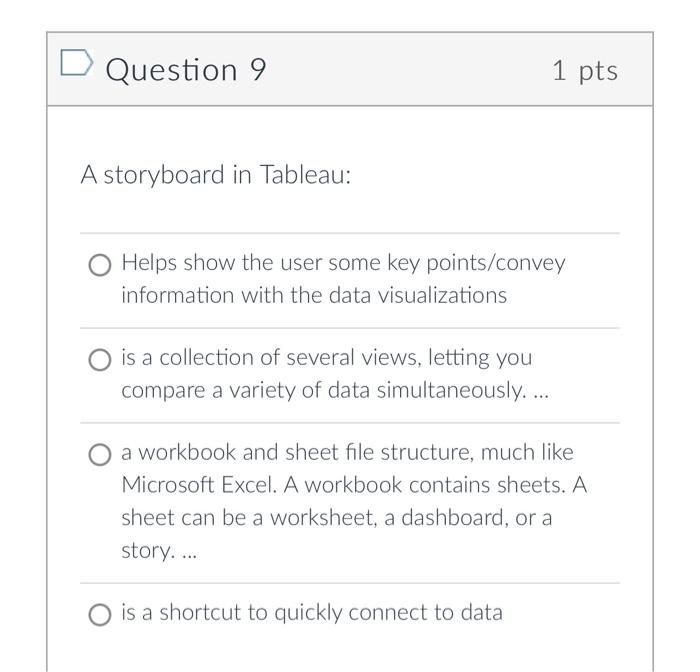
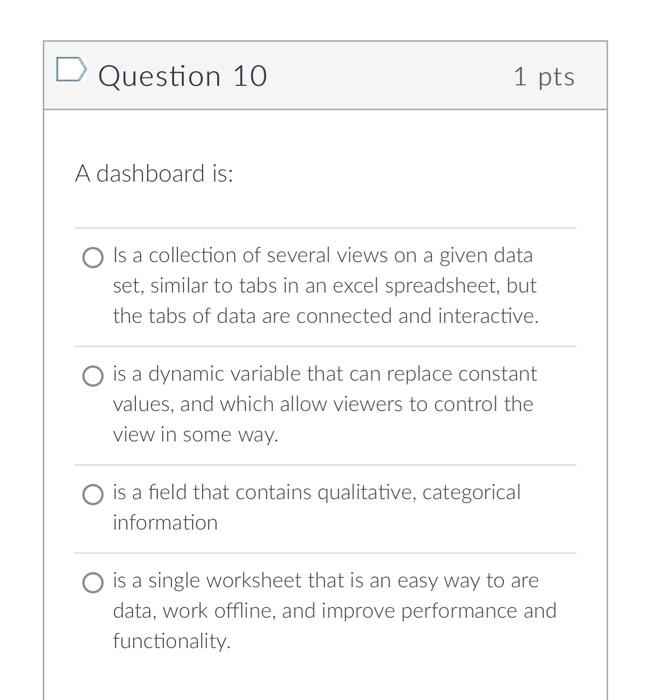
To access the data behind a visualization (chart) you have created, you can right click on the visualization and click "copy" and paste the data into an Excel spreadsheet. True False Question 3 1 pts Which one of the following is not an aggregation you would see under "measure"? Average Sum Median Group Which of the following would not be considered a measure in Tableau? Customer Name Profit Sales commissions Quantity ordered Question 5 1pts To bring data into tableau, you can connect to: New Data Saved Data Open recently saved data All of the above Suppose your company has sales throughout the United States, and all sales have an order number that lists the two digit code for the state, a hyphen, and the order #. (i.e. FL1234). If you want to isolate the state in order to prepare a sales analysis on a state by state level, you can: Split the field by clicking the drop down, select "custom split", and then split on the hyphen, keeping the first column Split the field by clicking the drop down, select "split data"; it will know to split at the hyphen Copy the field by clicking the drop down menu, select "copy" to create a copy of this column into a second column, and then edit the data of each field to delete the order numbers Custom group the data, by clicking the drop down and selecting "custom groups" and then defining the groups of state and order # If you begin by analyzing sales data for your project, Tableau will automatically aggregate the data by: Days Months Quarters Years Question 8 1 pts You can only present your information in an aggregated format (i.e., total sales by region) rather than on a dis-aggregated, customer level. True False Question 9 1 pts A storyboard in Tableau: Helps show the user some key points/convey information with the data visualizations is a collection of several views, letting you compare a variety of data simultaneously.... a workbook and sheet file structure, much like Microsoft Excel. A workbook contains sheets. A sheet can be a worksheet, a dashboard, or a story.... is a shortcut to quickly connect to data Question 10 1 pts A dashboard is: Is a collection of several views on a given data set, similar to tabs in an excel spreadsheet, but the tabs of data are connected and interactive. is a dynamic variable that can replace constant values, and which allow viewers to control the view in some way. is a field that contains qualitative, categorical information is a single worksheet that is an easy way to are data, work offline, and improve performance and functionality
