To follow are the balance sheets for Baker Corporation and selected comparative competitor data. 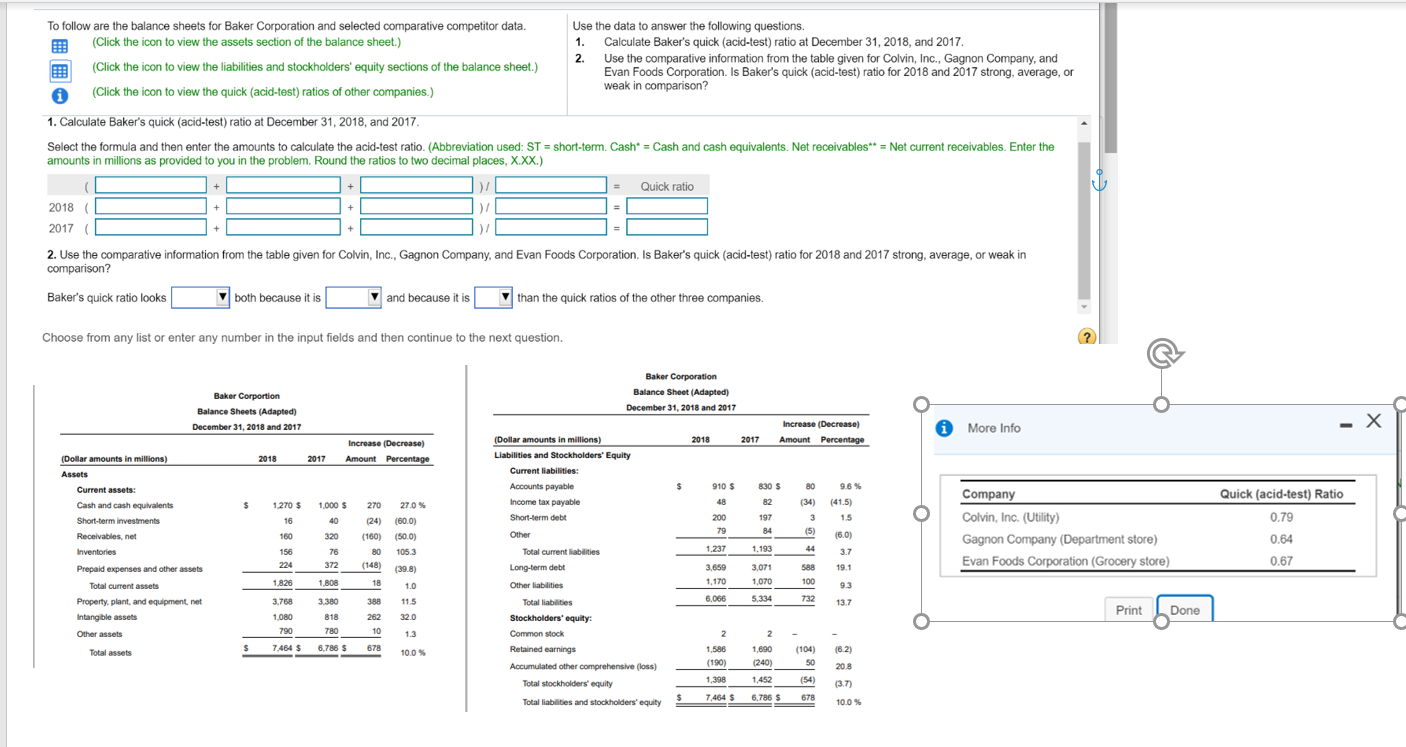
To follow are the balance sheets for Baker Corporation and selected comparative competitor data. (Click the icon to view the assets section of the balance sheet.) (Click the icon to view the liabilities and stockholders' equity sections of the balance sheet.) A (Click the icon to view the quick (acid-test) ratios of other companies.) Use the data to answer the following questions. 1. Calculate Baker's quick (acid-test) ratio at December 31, 2018, and 2017 2. Use the comparative information from the table given for Colvin, Inc., Gagnon Company, and Evan Foods Corporation. Is Baker's quick (acid-test) ratio for 2018 and 2017 strong, average, or weak in comparison? 1. Calculate Baker's quick (acid-test) ratio at December 31, 2018, and 2017 Select the formula and then enter the amounts to calculate the acid-test ratio. (Abbreviation used: ST = short-term. Cash* = Cash and cash equivalents. Net receivables** = Net current receivables. Enter the amounts in millions as provided to you in the problem. Round the ratios to two decimal places, X.XX.) J = Quick ratio 2018 ( 2017 ( 2. Use the comparative information from the table given for Colvin, Inc., Gagnon Company, and Evan Foods Corporation. Is Baker's quick (acid-test) ratio for 2018 and 2017 strong, average, or weak in comparison? Baker's quick ratio looks both because it is and because it is than the quick ratios of the other three companies. Choose from any list or enter any number in the input fields and then continue to the next question. Baker Corportion Balance Sheets (Adapted) December 31, 2018 and 2017 Baker Corporation Balance Sheet (Adapted) December 31, 2018 and 2017 Increase (Decrease) Amount Percentage 0 More Info 2018 2017 Increase (Decrease) Amount Percentage 2018 2017 (Dollar amounts in millions) Assets (Dollar amounts in millions) Liabilities and Stockholders' Equity Current liabilities: Accounts payable Income tax payable Short-term debt Current assets: 910 $ 830 $ 80 (34) 9.6% (41.5) 15 200 197 Cash and cash equivalents Short-term investments Receivables.net Inventories Quick (acid-test) Ratio 0.79 0.64 79 Other Company Colvin, Inc. (Utility) Gagnon Company (Department store) Evan Foods Corporation (Grocery store) 84 (6.0) 1.237 1.193 1.270 $ 1.000 $ 40 160 320 15676 372 1,826 1,808 3.768 3.380 1,080 818 790 780 Prepaid expenses and other assets 0.67 224 270 27.0 % (24) (60.0) (160) (50.0) 80 1053 (148) (39.8) 18 388 11.5 262 32.0 1013 678 100% Total current liabilities Long-term debt Other liabilities 3.659 1.170 Total current assets 10 Total liabilities 6,066 5,334 732 Property, plant, and equipment, net Intangible assets Other assets Print Done $ 7.464 $ Total assets 6.786 S Stockholders' equity: Common stock Retained earnings Accumulated other comprehensive (loss) Total stockholders' equity 2 1,586 (190) 1,398 7,464 $ 2 1.690 (240) 1,452 6,786 5 - (104) 50 (54) 678 (62) 20.8 (3.7) Total liabilities and stockholders' equity $ 100%