Answered step by step
Verified Expert Solution
Question
1 Approved Answer
tth izm r : Activity C: 0 Turn off Show derivative. Sine functions . Select Sine function. 1. Set a to 1. b to 1,
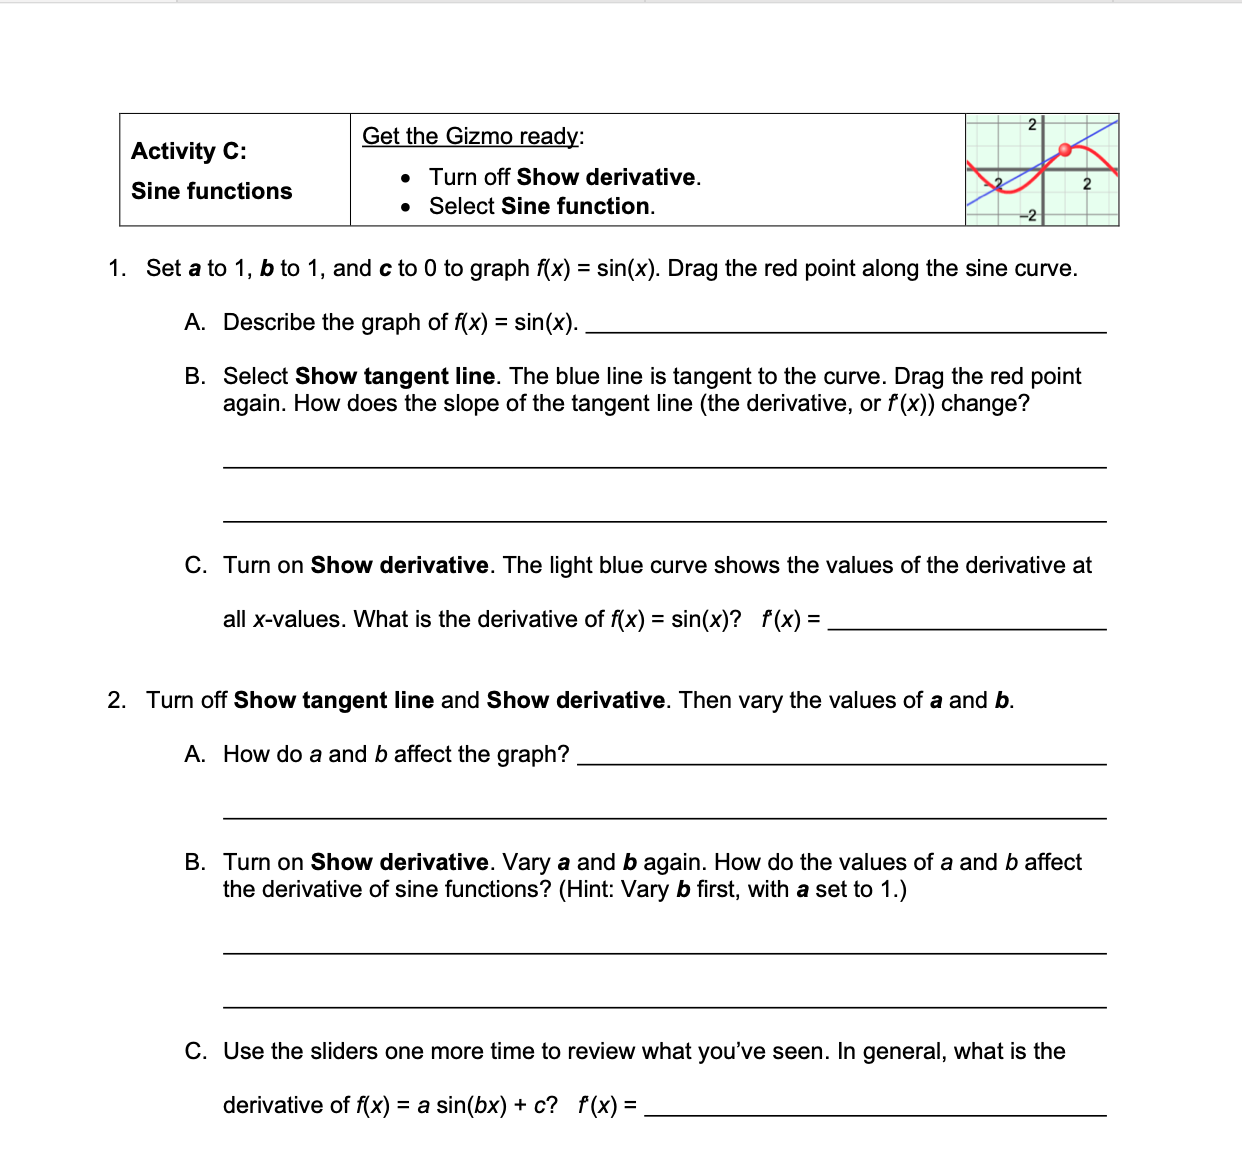
tth izm r : Activity C: 0 Turn off Show derivative. Sine functions . Select Sine function. 1. Set a to 1. b to 1, and c to 0 to graph f(x) = sin(x). Drag the red point along the sine curve. A. Describe the graph of x) = sin(x). B. Select Show tangent line. The blue line is tangent to the curve. Drag the red point again. How does the slope of the tangent line (the derivative, or f(x)) change? C. Turn on Show derivative. The light blue curve shows the values of the derivative at all x-values. What is the derivative of f(x) = sin(x)? f(x) = 2. Turn off Show tangent line and Show derivative. Then vary the values of a and b. A. How do a and b affect the graph? B. Turn on Show derivative. Vary a and b again. How do the values of a and b affect the derivative of sine functions? (Hint: Vary b rst. with a set to 1.) C. Use the sliders one more time to review what you've seen. In general, what is the derivative of x) = a sin(bx) + c? f'(x) =
Step by Step Solution
There are 3 Steps involved in it
Step: 1
Get Instant Access to Expert-Tailored Solutions
See step-by-step solutions with expert insights and AI powered tools for academic success
Step: 2
Step: 3
Ace Your Homework with AI
Get the answers you need in no time with our AI-driven, step-by-step assistance
Get Started