Answered step by step
Verified Expert Solution
Question
1 Approved Answer
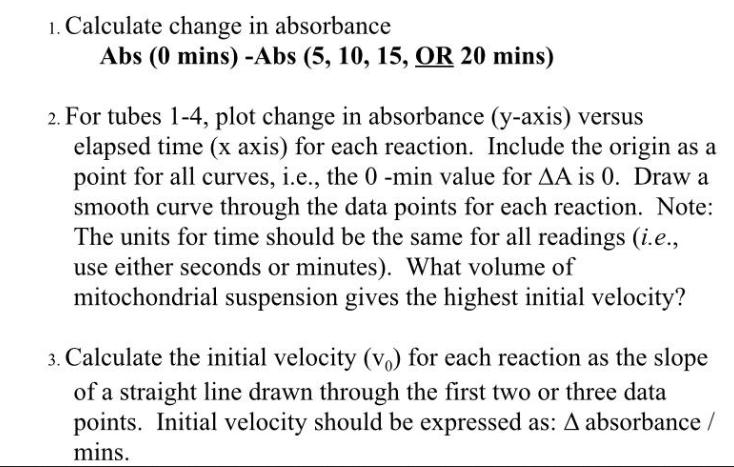
1. Calculate change in absorbance Abs (0 mins) -Abs (5, 10, 15, OR 20 mins) 2. For tubes 1-4, plot change in absorbance (y-axis)


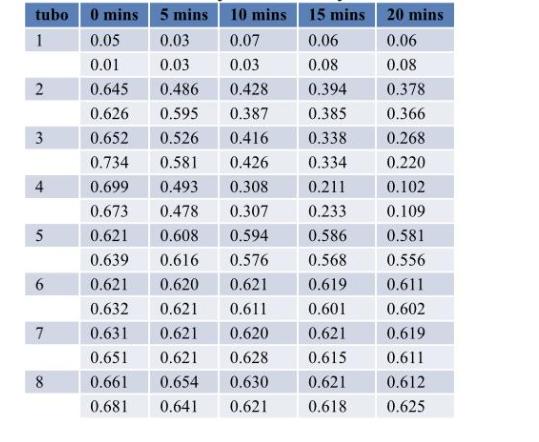
1. Calculate change in absorbance Abs (0 mins) -Abs (5, 10, 15, OR 20 mins) 2. For tubes 1-4, plot change in absorbance (y-axis) versus elapsed time (x axis) for each reaction. Include the origin as a point for all curves, i.e., the 0 -min value for AA is 0. Draw a smooth curve through the data points for each reaction. Note: The units for time should be the same for all readings (i.e., use either seconds or minutes). What volume of mitochondrial suspension gives the highest initial velocity? 3. Calculate the initial velocity (vo) for each reaction as the slope of a straight line drawn through the first two or three data points. Initial velocity should be expressed as: A absorbance / mins. tubo 1 2 3 4 5 6 7 8 0 mins 5 mins 10 mins 15 mins 20 mins 0.05 0.03 0.07 0.06 0.06 0.01 0.03 0.03 0.08 0.08 0.645 0.486 0.428 0.394 0.378 0.626 0.595 0.387 0.385 0.652 0.526 0.416 0.338 0.734 0.581 0.426 0.334 0.699 0.493 0.308 0.211 0.673 0.478 0.307 0.233 0.621 0.608 0.594 0.586 0.639 0.616 0.576 0.568 0.621 0.620 0.621 0.619 0.632 0.621 0.611 0.601 0.631 0.621 0.620 0.621 0.651 0.621 0.628 0.615 0.661 0.654 0.630 0.621 0.681 0.641 0.621 0.618 0.366 0.268 0.220 0.102 0.109 0.581 0.556 0.611 0.602 0.619 0.611 0.612 0.625
Step by Step Solution
★★★★★
3.83 Rating (213 Votes )
There are 3 Steps involved in it
Step: 1
Change in absorbance Tube 0 mins 5 mins 10 mins 15 mins 20 mins ...
Get Instant Access to Expert-Tailored Solutions
See step-by-step solutions with expert insights and AI powered tools for academic success
Step: 2

Step: 3

Ace Your Homework with AI
Get the answers you need in no time with our AI-driven, step-by-step assistance
Get Started


