

Answered step by step
Verified Expert Solution
Question
1 Approved Answer
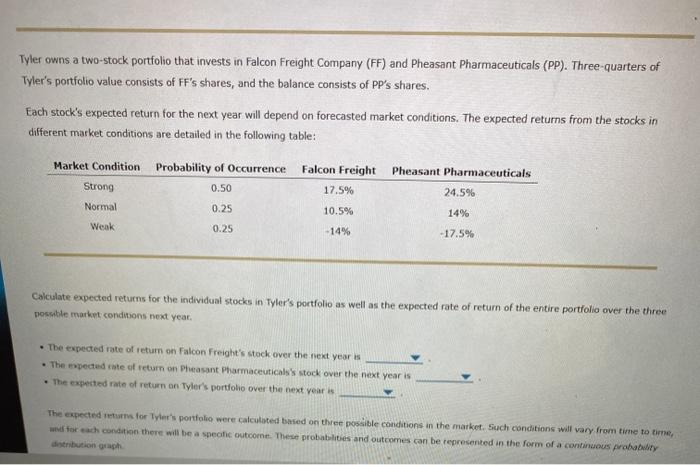
Tyler owns a two-stock portfolio that invests in Falcon Freight Company (FF) and Pheasant Pharmaceuticals (PP). Three-quarters of Tyler's portfolio value consists of FF's shares,
Step by Step Solution
There are 3 Steps involved in it
Step: 1

Get Instant Access to Expert-Tailored Solutions
See step-by-step solutions with expert insights and AI powered tools for academic success
Step: 2

Step: 3
Ace Your Homework with AI
Get the answers you need in no time with our AI-driven, step-by-step assistance
Get Started
The Misbehavior Of Markets A Fractal View Of Financial Turbulence
Authors: Benoit Mandelbrot, Richard L Hudson
1st Edition
0465043577, 978-0465043576