Question
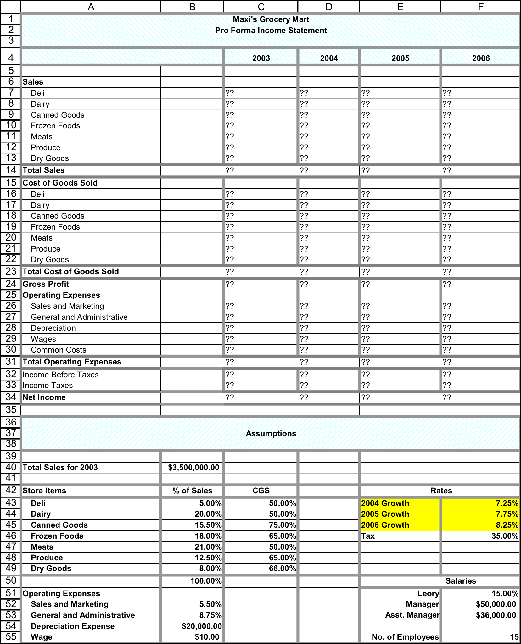
Type or paste question he Details of the worksheet PFIS It is now end of year 2003 and the total sales for year 2003 is
Type or paste question he
Details of the worksheet PFIS
It is now end of year 2003 and the total sales for year 2003 is $3500000.00 (in cells A40 and B40), and the pro forma income statements need to forecast the net income for years 2004 to 2006 based on year 2003s figures. The following assumptions are made (see cells A42 to F55):
Tax rate for each year is 35% (cell F46).
Sales for Deli are 5% of total sales for each year (cell B43).
Sales for Dairy are 20% of total sales for each year (cell B44).
Sales for Canned Goods are 15.5% of total sales for each year (cell B45).
Sales for Frozen Foods are 18% of total sales for each year (cell B46).
Sales for Meats are 21% of total sales for each year (cell B47).
Sales for Produce are 12.5% of total sales for each year (cell B48).
Sales for Dry Goods are 8% of total sales for each year (cell B49).
Cost of Goods sold (CGS) for Deli is 50% of deli sales each year (cell C43).
Cost of Goods sold (CGS) for Dairy is 50% of dairy sales each year (cell C44).
Cost of Goods sold (CGS) for Canned Goods is 75% of canned goods sales each year (cell C45).
Cost of Goods sold (CGS) for Frozen foods is 65% of frozen food sales each year (cell C46).
Cost of Goods sold (CGS) for Meats is 50% of meat sales each year (cell C47).
Cost of Goods sold (CGS) for Produce is 65% of produce sales each year (cell C48).
Cost of Goods sold (CGS) for Dry goods is 66% of dry good sales each year (cell C49).
Operating expense for sales & marketing is 5.5% of total sales each year (cell B52).
Operating expense for general & administrative is 8.75% of total sales each year (cell B53).
Depreciation is $20,000.00 per year (cell B54).
Salaries information
Mr. Leory employs a store manager, an assistant manger and 15 full-time employees (cell F55). The manager and assistant manager are paid yearly salaries (cells F52, F53), and the 15 employees are paid an hourly wage, $10 per hour (cell B55). Each employee works 40 hours per week, 50 weeks a year. Row 29 contains the formula for the yearly total salaries for all the managers and employees.
Mr. Leory Maxi also works in the mart, and he takes 15% of gross profit (cell F51) as salary if the gross profit is positive.
Note: Mr. Leory Maxis salary is classified as common costs in row 30.
Maxis Grocery Mart needs to pay income taxes (Row 33) only if income (before taxes) is positive.
Growth information (Note: Growth rate applies to previous years figures, and applies to everything except wages, common costs, tax and depreciation.)
Growth rate for 2004 is 7.25% (cell F43).
Growth rate for 2005 is 7.75% (cell F44).
Growth rate for 2006 is 8.25% (cell F45).
e
Step by Step Solution
There are 3 Steps involved in it
Step: 1

Get Instant Access to Expert-Tailored Solutions
See step-by-step solutions with expert insights and AI powered tools for academic success
Step: 2

Step: 3

Ace Your Homework with AI
Get the answers you need in no time with our AI-driven, step-by-step assistance
Get Started


