

Question
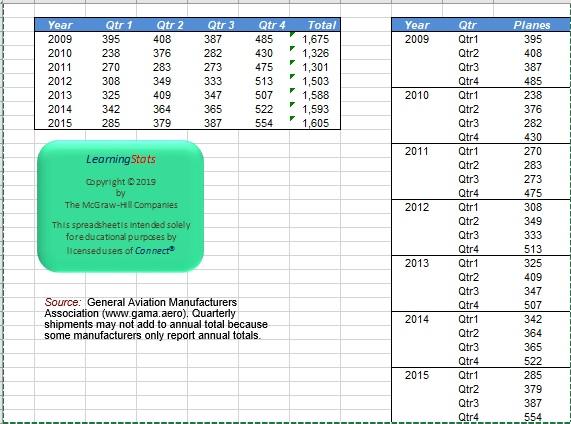
U.S. Manufactured General Aviation Shipments, 20092015 Year Qtr 1 Qtr 2 Qtr 3 Qtr 4 Total 2009 395 408 387 485 1,675 2010 238 376
| U.S. Manufactured General Aviation Shipments, 20092015 | |||||||||||||||||||||
| Year | Qtr 1 | Qtr 2 | Qtr 3 | Qtr 4 | Total | ||||||||||||||||
| 2009 | 395 | 408 | 387 | 485 | 1,675 | ||||||||||||||||
| 2010 | 238 | 376 | 282 | 430 | 1,326 | ||||||||||||||||
| 2011 | 270 | 283 | 273 | 475 | 1,301 | ||||||||||||||||
| 2012 | 308 | 349 | 333 | 513 | 1,503 | ||||||||||||||||
| 2013 | 325 | 409 | 347 | 507 | 1,588 | ||||||||||||||||
| 2014 | 342 | 364 | 365 | 522 | 1,593 | ||||||||||||||||
| 2015 | 285 | 379 | 387 | 554 | 1,605 | ||||||||||||||||
Click here for the Excel Data File
(a) Plot the data on airplane shipments.
| Plot A | Plot B | Plot C | Plot D |
multiple choice 1
-
Plot A
-
Plot B
-
Plot C
-
Plot D
(b) Can you see seasonal patterns? multiple choice 2
-
Yes
-
No
(c) Use MegaStat or Minitab to calculate estimated seasonal indexes and trend. (Round your answers to 3 decimal places.)
| Qtr1 Index | Qtr2 Index | Qtr3 Index | Qtr4 Index | |||||||||||
(d) In which quarters are shipments highest? Lowest? (You may select more than one answer. Click the box with a check mark for the correct answer and double click to empty the box for the wrong answer.) Highest check all that apply 1
- Q1
- Q2
- Q3
- Q4
Lowest check all that apply 2
- Q1
- Q2
- Q3
- Q4
(e) Is there a trend in the deseasonalized data? There is a slight (Click to select) increasing decreasing trend in the deseasonalized data.
Step by Step Solution
There are 3 Steps involved in it
Step: 1

Get Instant Access to Expert-Tailored Solutions
See step-by-step solutions with expert insights and AI powered tools for academic success
Step: 2

Step: 3
Ace Your Homework with AI
Get the answers you need in no time with our AI-driven, step-by-step assistance
Get Started
Investing For Women Smart Strategies To Start Investing Now With Confidence Low Risk And Minimal Effort
Authors: Mike Hartley ,Hannah Rosenstein
1st Edition
979-8393237202