Use the dividend discount model to value a share of Toyotas stock (ticker symbol: TM) as of December 31, 2020. In your application of this model, use the data provided on the most recent Toyota Value Line report (history of their annual dividend payments, forecasts of future annual dividend payments, past and forecasted growth rates in dividends, and Value Lines estimate of Toyotas equity beta). Given all of the dividend data (historic and forecasted) presented in the Value Line report, explain, in one sentence, the logic you used to estimate the expected future constant growth rate in dividends in perpetuity (g).
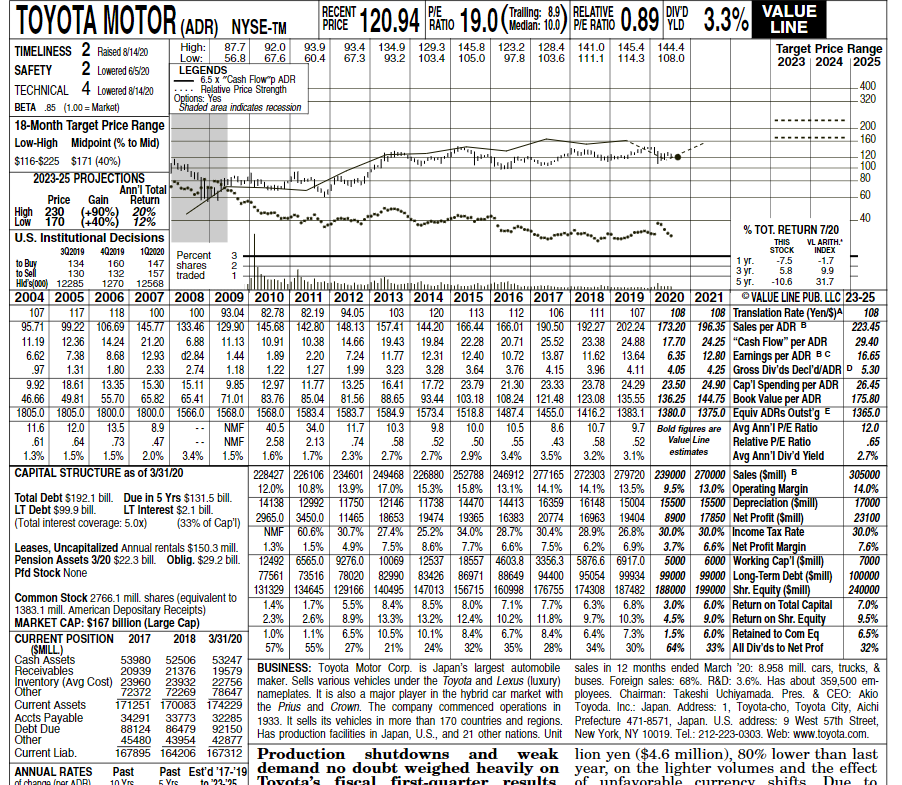
TOYOTA MOTOR (ADR) NYSE-TA Top 102020 Percent 157 traded 9.9 PIE Trallng8.9 RELATIVE VALUE PRICE YLD LINE TIMELINESS 2 Raised 8/14/20 High: 87.7 92.0 93.9 93.4 134.9 129.3 145.8 123.2 128.4 141.0 145.4 144.4 Target Price Range Low: 56.9 67.6 60.4 67.3 93.2 103.4 105.0 97.8 103.6 111.1 114.3 108.0 SAFETY 2 Lowered 6/5/20 2023 2024 2025 LEGENDS 6.5 X "Cash Flow" ADR TECHNICAL 4 Lowered 8/14/20 Relative Price Strength 400 Options: Yes 320 BETA.85 (1.00 = Market) Shaded area indicates recession 18-Month Target Price Range 200 Low-High Midpoint (% to Mid) 160 120 $116-$225 $171 (40%) 100 2023-25 PROJECTIONS .80 Ann'l Total Price Gain .60 Return High 230 (+90% 20% Low 170 (+40%) 12% 40 % TOT. RETURN 7/20 U.S. Institutional Decisions THIS VL ARITH. 3Q2019 402019 3 STOCK INDEX to Buy 134 160 147 shares 2 1 yr. -7.5 -1.7 to Sell 130 132 1 3 yr. 5.8 Hid'000) 12285 1270 12568 5 yr. -10.6 31.7 2004 2005 2006 2007 2008 2009 2010 2011 2012 2013 2014 2015 2016 2017 2018 2019 2020 2021 VALUE LINE PUB. LLC 23-25 107 117 118 100 100 93.04 82.78 82.19 94.05 103 120 113 112 106 111 107 108 108 Translation Rate (Yen/$) A 108 95.71 99.22 106.69 145.77 133.46 129.90 145.68 142.80 148.13 157.41 144.20 166.44 166.01 190.50 192.27 202.24 173.20 196.35 Sales per ADR B 223.45 11.19 12.36 14.24 21.20 6.88 11.13 10.91 10.38 14.66 19.43 19.84 22.28 20.71 25.52 23.38 24.88 17.70 24.25 "Cash Flow" per ADR 29.40 6.62 7.38 8.68 12.93 d2.84 1.44 1.89 2.20 7.24 11.77 12.31 12.40 10.72 13.87 11.62 13.64 6.35 12.80 Earnings per ADR BC 16.65 .97 1.31 1.80 2.33 2.74 1.18 1.22 1.27 1.99 3.23 3.28 3.64 3.76 4.15 3.96 4.11 4.05 4.25 Gross Div'ds Decl'dADR D 5.30 9.92 18.61 13.35 15.30 15.11 9.85 12.97 11.77 13.25 16.41 17.72 23.79 21.30 23.33 23.78 24.29 23.50 24.90 Cap'l Spending per ADR 26.45 46.66 49.81 55.70 65.82 65.41 71.01 83.76 85.04 81.56 88.65 93.44 103.18 108.24 121.48 123.08 135.55 136.25 144.75 Book Value per ADR 175.80 1805.0 1805.0 1800.0 1800.0 1566.0 1568.0 1568.0 1583.4 1583.7 1584.9 1573.4 1518.8 1487.4 1455.0 1416.2 1383.1 1380.0 1375.0 Equiv ADRs Outst'g E 1365.0 11.6 12.0 13.5 8.9 NMF 40.5 34.0 11.7 10.3 9.8 10.0 10.5 8.6 10.7 9.7 Bold figures are Avg Ann'i P/E Ratio 12.0 .61 .64 .73 47 2.58 2.13 .74 .58 .52 .50 .55 .43 .58 .52 Value Line Relative P/E Ratio .65 1.3% 1.5% 1.5% 2.0% 3.4% 1.5% 1.6% 1.7% 2.3% 2.7% 2.7% 2.9% 3.4% 3.5% 3.2% 3.1% estimates Avg Ann'l Div'd Yield 2.7% CAPITAL STRUCTURE as of 3/31/20 228427 226106 234601 249468 226880 252788 246912 277165 272303 279720 239000 270000 Sales (Smill) 305000 12.0% 10.8% 13.9% 17.0% 15.3% 15.8% | 13.1% 14.1% 14.1% 13.5% 9.5% 13.0% Operating Margin 14.0% Total Debt $192.1 bill. Due in 5 yrs $131.5 bill. 14138 12992 11750 12146 11738 14470 14413 16359 16148 15004 15500 15500 Depreciation (Smill) 17000 LT Debt $99.9 bill. LT Interest $2.1 bill. (Total interest coverage: 5.0x) 2965.0 3450.0 11465 (33% of Cap'l) 18653 19474 19365 16383 20774 16963 8900 19404 17850 Net Profit (Smill) 23100 NMF 60.6% 30.7% 27.4% 25.2% 34.0% 28.7% 30.4% 28.9% 26.8% 30.0% 30.0% Income Tax Rate 30.0% Leases, Uncapitalized Annual rentals $150.3 mill. 1.3% 1.5% 4.9% 7.5% 8.6% 7.7% 6.6% 7.5% 6.2% 6.9% 3.7% 6.6% Net Profit Margin 7.6% Pension Assets 3/20 $22.3 bill. Oblig. $29.2 bill. 12492 6565.0 9276.0 10069 12537 18557 4603.8 3356.3 5876.6 6917.0 5000 6000 Working Cap'l (Smill) 7000 Pfd Stock None 77561 73516 78020 82990 83426 86971 88649 94400 95054 99934 99000 99000 Long-Term Debt (Smill) 100000 240000 Common Stock 2766.1 mill. shares (equivalent to 131329 134645 129166 140495 147013 156715 160998 176755 174308 187482 188000 199000 Shr. Equity (Smill) 1383.1 mill. American Depositary Receipts) 1.7% 5.5% 8.4% 8.5% 8.0% 7.1% 7.7% 6.3% 6.8% 3.0% 6.0% Return on Total Capital 7.0% MARKET CAP: $167 billion (Large Cap) 2.3% 2.6% 8.9% 13.3% 13.2% 12.4% 10.2% 11.8% 9.7% 10.3% 4.5% 9.0% Return on Shr. Equity 9.5% CURRENT POSITION 2017 2018 3/31/20 1.0% 1.1% 6.5% 10.5% 10.1% 8.4% 6.7% 8.4% 6.4% 7.3% 1.5% 6.0% Retained to Com Eq 6.5% (SMILL.) 57% 55% 27% 21% 24% 32% 35% 28% 34% 30% 64% 33% All Div'ds to Net Prof 32% Cash Assets 53980 52506 53247 Receivables 20939 21376 19579 BUSINESS: Toyota Motor Corp. is Japan's largest automobile sales in 12 months ended March 20: 8.958 mill. cars, trucks, & Inventory (Avg Cost) 23960 23932 22756 maker. Sells various vehicles under the Toyota and Lexus (luxury) buses. Foreign sales: 68%. R&D: 3.6%. Has about 359,500 em- Other 72372 72269 78647 nameplates. It is also a major player in the hybrid car market with ployees. Chairman: Takeshi Uchiyamada. Pres. & CEO: Akio Current Assets 171251 170083 174229 the Prius and Crown. The company commenced operations in Toyoda. Inc.: Japan. Address: 1, Toyota-cho, Toyota City, Aichi Accts Payable 34291 33773 32285 1933. It sells its vehicles in more than 170 countries and regions. Prefecture 471-8571, Japan. U.S. address: 9 West 57th Street, Debt Due 88124 86479 92150 Other 45480 43954 42877 Has production facilities in Japan, U.S., and 21 other nations. Unit New York, NY 10019. Tel: 212-223-0303. Web: www.toyota.com. Current Liab. 167895 164206 167312 Production shutdowns and weak lion yen ($4.6 million), 80% lower than last ANNUAL RATES Past Past Est'd '17-'19 demand no doubt weighed heavily on year, on the lighter volumes and the effect 5 Yrs to 22.25 Toyota's fiscal first quarter results of unfavorable currency shifts Due to NMF of change inar ANBI 10 Vre TOYOTA MOTOR (ADR) NYSE-TA Top 102020 Percent 157 traded 9.9 PIE Trallng8.9 RELATIVE VALUE PRICE YLD LINE TIMELINESS 2 Raised 8/14/20 High: 87.7 92.0 93.9 93.4 134.9 129.3 145.8 123.2 128.4 141.0 145.4 144.4 Target Price Range Low: 56.9 67.6 60.4 67.3 93.2 103.4 105.0 97.8 103.6 111.1 114.3 108.0 SAFETY 2 Lowered 6/5/20 2023 2024 2025 LEGENDS 6.5 X "Cash Flow" ADR TECHNICAL 4 Lowered 8/14/20 Relative Price Strength 400 Options: Yes 320 BETA.85 (1.00 = Market) Shaded area indicates recession 18-Month Target Price Range 200 Low-High Midpoint (% to Mid) 160 120 $116-$225 $171 (40%) 100 2023-25 PROJECTIONS .80 Ann'l Total Price Gain .60 Return High 230 (+90% 20% Low 170 (+40%) 12% 40 % TOT. RETURN 7/20 U.S. Institutional Decisions THIS VL ARITH. 3Q2019 402019 3 STOCK INDEX to Buy 134 160 147 shares 2 1 yr. -7.5 -1.7 to Sell 130 132 1 3 yr. 5.8 Hid'000) 12285 1270 12568 5 yr. -10.6 31.7 2004 2005 2006 2007 2008 2009 2010 2011 2012 2013 2014 2015 2016 2017 2018 2019 2020 2021 VALUE LINE PUB. LLC 23-25 107 117 118 100 100 93.04 82.78 82.19 94.05 103 120 113 112 106 111 107 108 108 Translation Rate (Yen/$) A 108 95.71 99.22 106.69 145.77 133.46 129.90 145.68 142.80 148.13 157.41 144.20 166.44 166.01 190.50 192.27 202.24 173.20 196.35 Sales per ADR B 223.45 11.19 12.36 14.24 21.20 6.88 11.13 10.91 10.38 14.66 19.43 19.84 22.28 20.71 25.52 23.38 24.88 17.70 24.25 "Cash Flow" per ADR 29.40 6.62 7.38 8.68 12.93 d2.84 1.44 1.89 2.20 7.24 11.77 12.31 12.40 10.72 13.87 11.62 13.64 6.35 12.80 Earnings per ADR BC 16.65 .97 1.31 1.80 2.33 2.74 1.18 1.22 1.27 1.99 3.23 3.28 3.64 3.76 4.15 3.96 4.11 4.05 4.25 Gross Div'ds Decl'dADR D 5.30 9.92 18.61 13.35 15.30 15.11 9.85 12.97 11.77 13.25 16.41 17.72 23.79 21.30 23.33 23.78 24.29 23.50 24.90 Cap'l Spending per ADR 26.45 46.66 49.81 55.70 65.82 65.41 71.01 83.76 85.04 81.56 88.65 93.44 103.18 108.24 121.48 123.08 135.55 136.25 144.75 Book Value per ADR 175.80 1805.0 1805.0 1800.0 1800.0 1566.0 1568.0 1568.0 1583.4 1583.7 1584.9 1573.4 1518.8 1487.4 1455.0 1416.2 1383.1 1380.0 1375.0 Equiv ADRs Outst'g E 1365.0 11.6 12.0 13.5 8.9 NMF 40.5 34.0 11.7 10.3 9.8 10.0 10.5 8.6 10.7 9.7 Bold figures are Avg Ann'i P/E Ratio 12.0 .61 .64 .73 47 2.58 2.13 .74 .58 .52 .50 .55 .43 .58 .52 Value Line Relative P/E Ratio .65 1.3% 1.5% 1.5% 2.0% 3.4% 1.5% 1.6% 1.7% 2.3% 2.7% 2.7% 2.9% 3.4% 3.5% 3.2% 3.1% estimates Avg Ann'l Div'd Yield 2.7% CAPITAL STRUCTURE as of 3/31/20 228427 226106 234601 249468 226880 252788 246912 277165 272303 279720 239000 270000 Sales (Smill) 305000 12.0% 10.8% 13.9% 17.0% 15.3% 15.8% | 13.1% 14.1% 14.1% 13.5% 9.5% 13.0% Operating Margin 14.0% Total Debt $192.1 bill. Due in 5 yrs $131.5 bill. 14138 12992 11750 12146 11738 14470 14413 16359 16148 15004 15500 15500 Depreciation (Smill) 17000 LT Debt $99.9 bill. LT Interest $2.1 bill. (Total interest coverage: 5.0x) 2965.0 3450.0 11465 (33% of Cap'l) 18653 19474 19365 16383 20774 16963 8900 19404 17850 Net Profit (Smill) 23100 NMF 60.6% 30.7% 27.4% 25.2% 34.0% 28.7% 30.4% 28.9% 26.8% 30.0% 30.0% Income Tax Rate 30.0% Leases, Uncapitalized Annual rentals $150.3 mill. 1.3% 1.5% 4.9% 7.5% 8.6% 7.7% 6.6% 7.5% 6.2% 6.9% 3.7% 6.6% Net Profit Margin 7.6% Pension Assets 3/20 $22.3 bill. Oblig. $29.2 bill. 12492 6565.0 9276.0 10069 12537 18557 4603.8 3356.3 5876.6 6917.0 5000 6000 Working Cap'l (Smill) 7000 Pfd Stock None 77561 73516 78020 82990 83426 86971 88649 94400 95054 99934 99000 99000 Long-Term Debt (Smill) 100000 240000 Common Stock 2766.1 mill. shares (equivalent to 131329 134645 129166 140495 147013 156715 160998 176755 174308 187482 188000 199000 Shr. Equity (Smill) 1383.1 mill. American Depositary Receipts) 1.7% 5.5% 8.4% 8.5% 8.0% 7.1% 7.7% 6.3% 6.8% 3.0% 6.0% Return on Total Capital 7.0% MARKET CAP: $167 billion (Large Cap) 2.3% 2.6% 8.9% 13.3% 13.2% 12.4% 10.2% 11.8% 9.7% 10.3% 4.5% 9.0% Return on Shr. Equity 9.5% CURRENT POSITION 2017 2018 3/31/20 1.0% 1.1% 6.5% 10.5% 10.1% 8.4% 6.7% 8.4% 6.4% 7.3% 1.5% 6.0% Retained to Com Eq 6.5% (SMILL.) 57% 55% 27% 21% 24% 32% 35% 28% 34% 30% 64% 33% All Div'ds to Net Prof 32% Cash Assets 53980 52506 53247 Receivables 20939 21376 19579 BUSINESS: Toyota Motor Corp. is Japan's largest automobile sales in 12 months ended March 20: 8.958 mill. cars, trucks, & Inventory (Avg Cost) 23960 23932 22756 maker. Sells various vehicles under the Toyota and Lexus (luxury) buses. Foreign sales: 68%. R&D: 3.6%. Has about 359,500 em- Other 72372 72269 78647 nameplates. It is also a major player in the hybrid car market with ployees. Chairman: Takeshi Uchiyamada. Pres. & CEO: Akio Current Assets 171251 170083 174229 the Prius and Crown. The company commenced operations in Toyoda. Inc.: Japan. Address: 1, Toyota-cho, Toyota City, Aichi Accts Payable 34291 33773 32285 1933. It sells its vehicles in more than 170 countries and regions. Prefecture 471-8571, Japan. U.S. address: 9 West 57th Street, Debt Due 88124 86479 92150 Other 45480 43954 42877 Has production facilities in Japan, U.S., and 21 other nations. Unit New York, NY 10019. Tel: 212-223-0303. Web: www.toyota.com. Current Liab. 167895 164206 167312 Production shutdowns and weak lion yen ($4.6 million), 80% lower than last ANNUAL RATES Past Past Est'd '17-'19 demand no doubt weighed heavily on year, on the lighter volumes and the effect 5 Yrs to 22.25 Toyota's fiscal first quarter results of unfavorable currency shifts Due to NMF of change inar ANBI 10 Vre