Use the following assumptions to value Saito Solar based on the discounted cash flow method. Assume the Actual 2012 numbers given in Appendix 3.
Numbers 1 and 2 please please show work Thank you Excel if possible
- For the next 5 years (2013-2017), the companys sales is expected to grow by 25% per year.
- All expenses (except depreciation) are expected to grow by 20% per year.
-
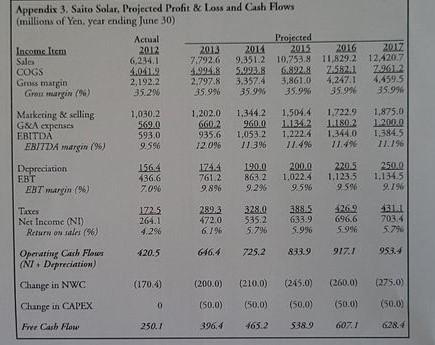
Gros margin Appendix 3. Saito Solar, Projected Profit & Loss and Cash Flows (millions of Yen year ending June 30) Actual Projected Income Item 2012 2013 2014 2015 2016 2017 Sales 6,234,1 7.792.6 9.351.2 10.753.8 11 829.2 12,420.7 COGS 4.0412 4.994.8 5.993,8 6.892.8 7.582.1 7.9012 2,192.2 2,797.8 3.3574 3,861,0 4.2471 4.459.5 Giru margi (6) 35.29 35.99 35.9% 35.9% 35.99 35.996 Marketing & selling 1,030.2 1,202.01.344.2 1.504.4 1.722.9 1,875.0 G&A expenses 56920 6602 9600 11342 LISO 2 12000 593.0 935.6 1.053.21.222.4 1.222.4 1.344.0 1,384.5 EBITDA margin(96) 9.59 12.096 1/ 3% 11.4% 17:49 11.196 Depreciation 1564 174.4 190.0 2000 220.5 2500 436.6 7612 863 21.022.4 1.1235 1.1345 EBT margin(96) 7.096 9.896 9.296 9.596 9 59 2.79 Taxes Net Income (NI) Return on sale (96 1725 264.1 4.29 289,3 472.0 6.796 3280 535.2 5.796 3885 633.9 5.996 769 696.6 5.996 13:11 7034 20.5 646.4 725.2 8339 917./ 9534 Operating Cash Flows (NT. Depreciation) Change in NWC (1704) (2000) (210.0) (245.0) (275.0) Change in CAPEX (50.0) (5000) (50,0) (50.0) 50,0) Free Cash Flow 250.7 396,4 465.2 5389 6071 Gros margin Appendix 3. Saito Solar, Projected Profit & Loss and Cash Flows (millions of Yen year ending June 30) Actual Projected Income Item 2012 2013 2014 2015 2016 2017 Sales 6,234,1 7.792.6 9.351.2 10.753.8 11 829.2 12,420.7 COGS 4.0412 4.994.8 5.993,8 6.892.8 7.582.1 7.9012 2,192.2 2,797.8 3.3574 3,861,0 4.2471 4.459.5 Giru margi (6) 35.29 35.99 35.9% 35.9% 35.99 35.996 Marketing & selling 1,030.2 1,202.01.344.2 1.504.4 1.722.9 1,875.0 G&A expenses 56920 6602 9600 11342 LISO 2 12000 593.0 935.6 1.053.21.222.4 1.222.4 1.344.0 1,384.5 EBITDA margin(96) 9.59 12.096 1/ 3% 11.4% 17:49 11.196 Depreciation 1564 174.4 190.0 2000 220.5 2500 436.6 7612 863 21.022.4 1.1235 1.1345 EBT margin(96) 7.096 9.896 9.296 9.596 9 59 2.79 Taxes Net Income (NI) Return on sale (96 1725 264.1 4.29 289,3 472.0 6.796 3280 535.2 5.796 3885 633.9 5.996 769 696.6 5.996 13:11 7034 20.5 646.4 725.2 8339 917./ 9534 Operating Cash Flows (NT. Depreciation) Change in NWC (1704) (2000) (210.0) (245.0) (275.0) Change in CAPEX (50.0) (5000) (50,0) (50.0) 50,0) Free Cash Flow 250.7 396,4 465.2 5389 6071