Answered step by step
Verified Expert Solution
Question
1 Approved Answer
USE THE FOLLOWING DATA TO ANSWER QUESTIONS 35-40 Sales COGS Gross profit Oper. exp Depreciation Operating profit Interest exp. EBT Taxes Net Income Annual Income
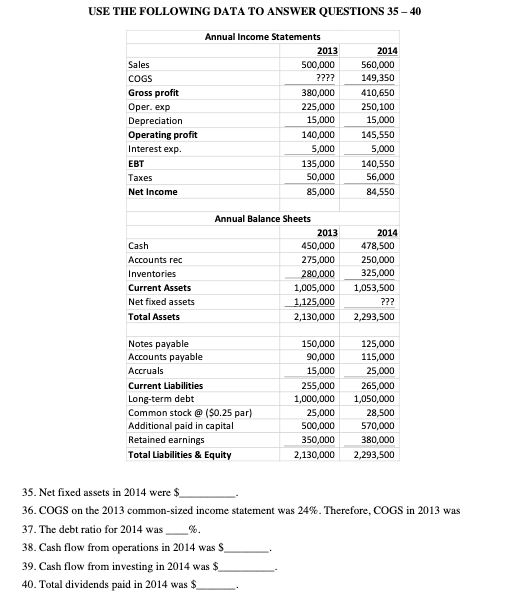
USE THE FOLLOWING DATA TO ANSWER QUESTIONS 35-40 Sales COGS Gross profit Oper. exp Depreciation Operating profit Interest exp. EBT Taxes Net Income Annual Income Statements 2013 500,000 ???? 380,000 225,000 15,000 140,000 5,000 135,000 50,000 85,000 2014 560,000 149,350 410,650 250,100 15,000 145,550 5,000 140,550 56,000 84,550 Cash Accounts rec Inventories Current Assets Net fixed assets Total Assets Annual Balance Sheets 2013 450,000 275,000 280,000 1,005,000 1,125,000 2,130,000 2014 478,500 250,000 325,000 1,053,500 ??? 2,293,500 Notes payable Accounts payable Accruals Current Liabilities Long-term debt Common stock @ ($0.25 par) Additional paid in capital Retained earnings Total Liabilities & Equity 150,000 90,000 15,000 255,000 1,000,000 25,000 500,000 350,000 2,130,000 125,000 115,000 25,000 265,000 1,050,000 28,500 570,000 380,000 2,293,500 35. Net fixed assets in 2014 were $ 36. COGS on the 2013 common-sized income statement was 24%. Therefore, COGS in 2013 was 37. The debt ratio for 2014 was__%. 38. Cash flow from operations in 2014 was S 39. Cash flow from investing in 2014 was $ 40. Total dividends paid in 2014 was $
Step by Step Solution
There are 3 Steps involved in it
Step: 1
Get Instant Access to Expert-Tailored Solutions
See step-by-step solutions with expert insights and AI powered tools for academic success
Step: 2
Step: 3
Ace Your Homework with AI
Get the answers you need in no time with our AI-driven, step-by-step assistance
Get Started