Answered step by step
Verified Expert Solution
Question
1 Approved Answer
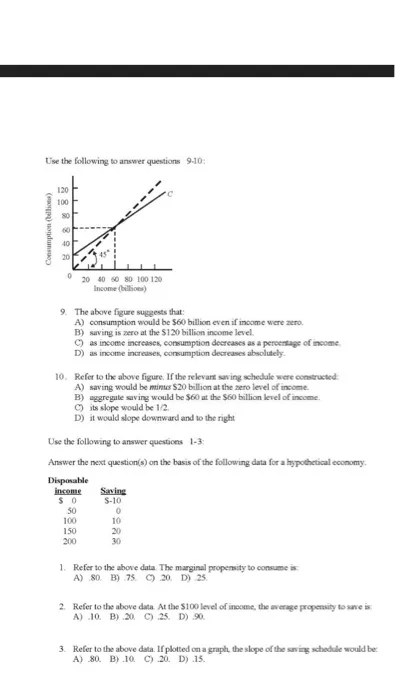
Use the following to answer questions 9-10: Consumption (billions) 120 100 80 60 40 20 0 20 40 60 80 100 120 Income (billions)

Use the following to answer questions 9-10: Consumption (billions) 120 100 80 60 40 20 0 20 40 60 80 100 120 Income (billions) 9. The above figure suggests that: A) consumption would be $60 billion even if income were zero. B) saving is zero at the $120 billion income level. C) as income increases, consumption decreases as a percentage of income. D) as income increases, consumption decreases absolutely 10. Refer to the above figure. If the relevant saving schedule were constructed: A) saving would be minus $20 billion at the zero level of income. B) aggregate saving would be $60 at the $60 billion level of income. C) its slope would be 1/2. D) it would slope downward and to the right Use the following to answer questions 1-3: Answer the next question(s) on the basis of the following data for a hypothetical economy. Disposable income $0 50 100 150 200 Saving $-10 0 10 20 30 1. Refer to the above data. The marginal propensity to consume is A) 80. B) 75 C) 20. D) 25. 2. Refer to the above data. At the $100 level of income, the average propensity to save is A) 10. B) 20 C) 25. D) 90 3. Refer to the above data. If plotted on a graph, the slope of the saving schedule would be: A) 80. B) .10 C) 20. D) .15.
Step by Step Solution
★★★★★
3.34 Rating (163 Votes )
There are 3 Steps involved in it
Step: 1
Lets break down the questions and answers The above figure suggests that A consumption would be 60 b...
Get Instant Access to Expert-Tailored Solutions
See step-by-step solutions with expert insights and AI powered tools for academic success
Step: 2

Step: 3

Ace Your Homework with AI
Get the answers you need in no time with our AI-driven, step-by-step assistance
Get Started


