Answered step by step
Verified Expert Solution
Question
1 Approved Answer
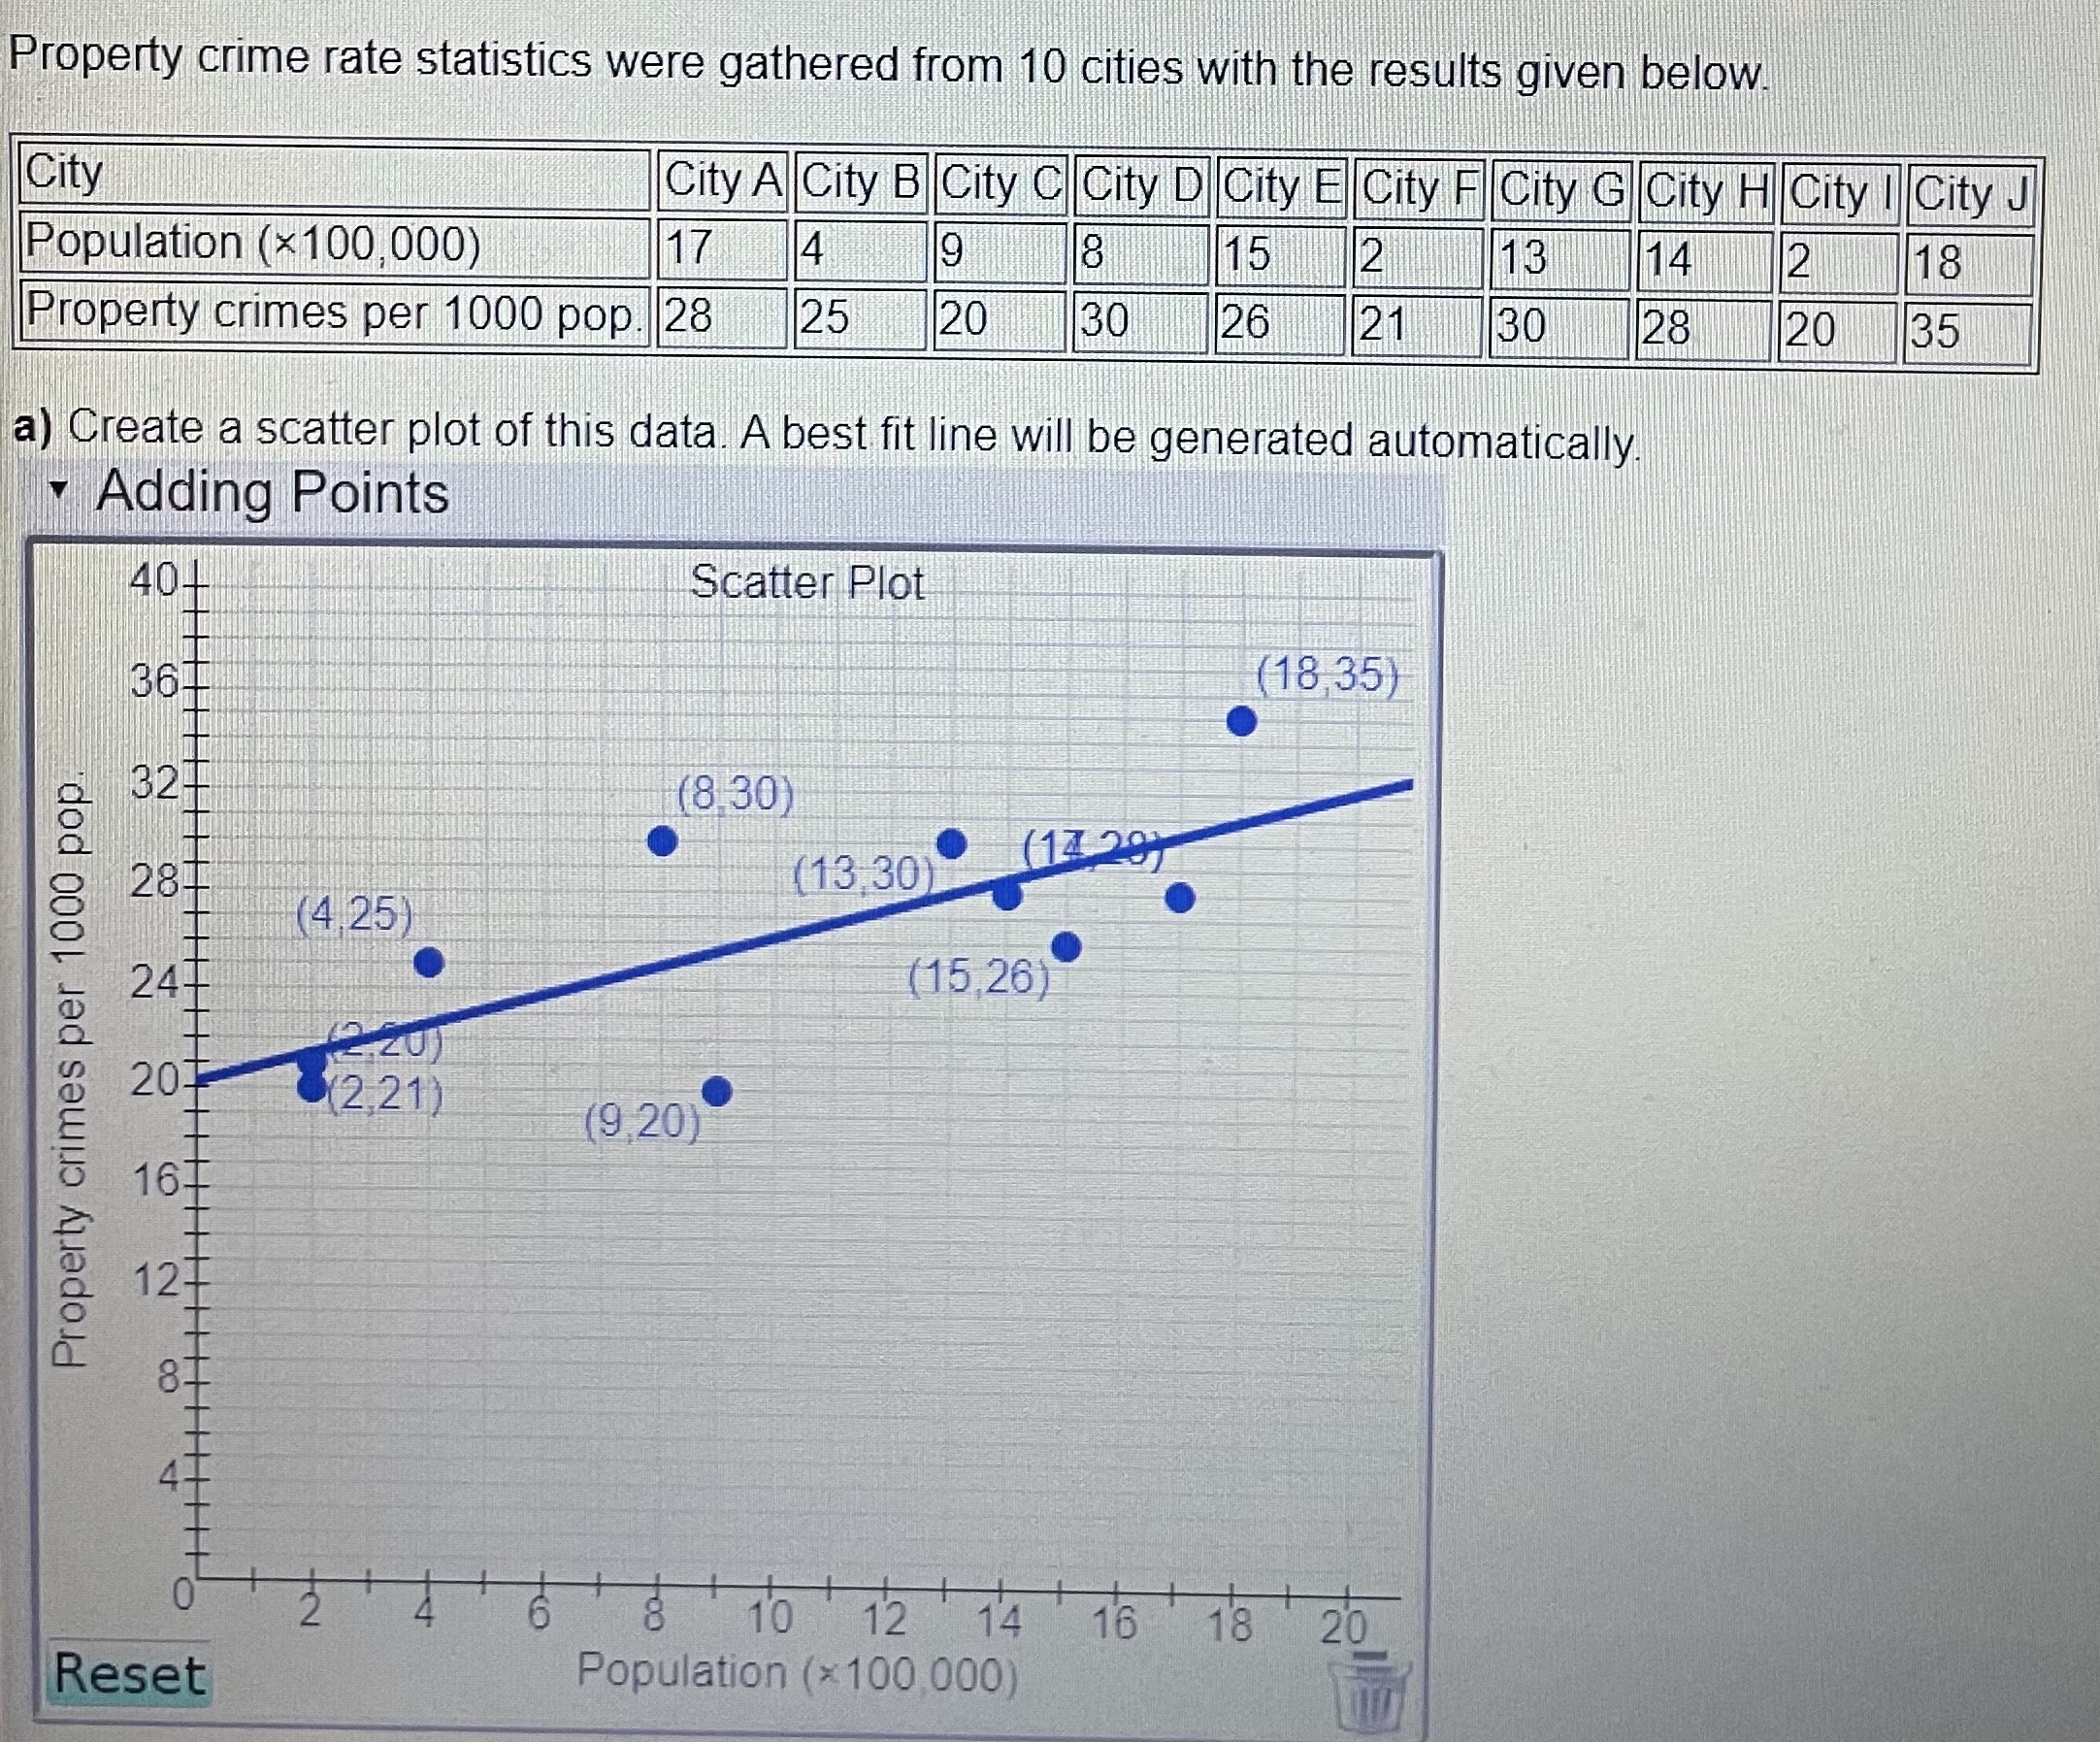
) Use the graph to estimate the crime per 1000 population in another city with a population of 1,300,000. Your answer should be within 0.5
) Use the graph to estimate the crime per 1000 population in another city with a population of 1,300,000. Your answer should be within 0.5 of the exact value. 0 crimes per 1000 pop. c) Use the graph to estimate the crime per 1000 population in another city with a population of 400,000. Your answer should be within 0.5 of the exact value. 0 crimes per 1000 pop.Property crime rate statistics were gathered from 10 cities with the results given below. City City A City B City C City D|City E City F|City G|City H| City | City J Population (x100,000) 17 4 9 8 15 2 13 14 2 18 Property crimes per 1000 pop. 28 25 20 30 26 21 30 128 20 35 a) Create a scatter plot of this data. A best fit line will be generated automatically. Adding Points 404 Scatter Plot (18,35) (8,30) (13,30) (14 29) (4,25) (15,26) 12 20 Property crimes per 1000 pop 20 (2,21) (9,20) 2 4 6 8 10 12 14 16 18 20 Reset Population (x100,000)
Step by Step Solution
There are 3 Steps involved in it
Step: 1
Get Instant Access to Expert-Tailored Solutions
See step-by-step solutions with expert insights and AI powered tools for academic success
Step: 2
Step: 3
Ace Your Homework with AI
Get the answers you need in no time with our AI-driven, step-by-step assistance
Get Started