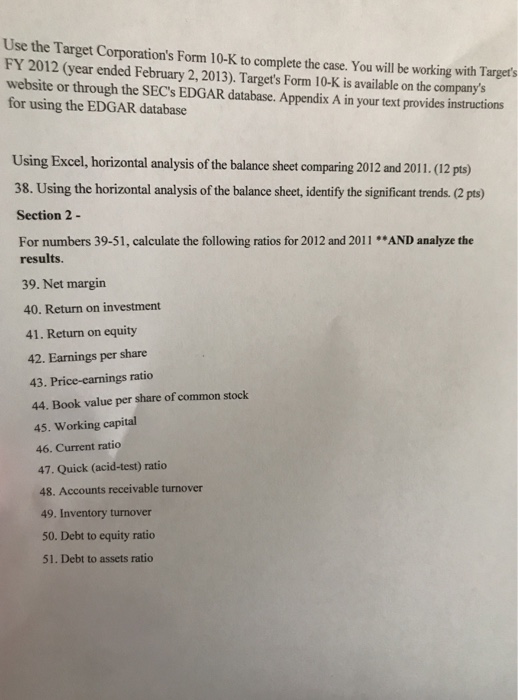
Use the Target Corporation's Form 10-K to complete the case. You will be working with Target's FY 2012 (year ended February 2, 2013). Target's Form 10-K is available on the company's website or through the SEC's EDGAR database. Appendix A in your text provides instructions for using the EDGAR database Using Excel, horizontal analysis of the balance sheet comparing 2012 and 2011.(12 pts) 38. Using the horizontal analysis of the balance sheet, identify the significant trends. (2 pts) Section 2- For numbers 39-51, calculate the following ratios for 2012 and 2011 *AND analyze the results. 39. Net margin 40. Return on investment 41. Return on equity 42. Earnings per share 43. Price-earnings ratio 44. Book value per share of common stock 45. Working capital 46. Current ratio 47. Quick (acid-test) ratio Accounts receivable turnover 48. 49. Inventory turnover 50. Debt to equity ratio 51. Debt to assets ratio Use the Target Corporation's Form 10-K to complete the case. You will be working with Target's FY 2012 (year ended February 2, 2013). Target's Form 10-K is available on the company's website or through the SEC's EDGAR database. Appendix A in your text provides instructions for using the EDGAR database Using Excel, horizontal analysis of the balance sheet comparing 2012 and 2011.(12 pts) 38. Using the horizontal analysis of the balance sheet, identify the significant trends. (2 pts) Section 2- For numbers 39-51, calculate the following ratios for 2012 and 2011 *AND analyze the results. 39. Net margin 40. Return on investment 41. Return on equity 42. Earnings per share 43. Price-earnings ratio 44. Book value per share of common stock 45. Working capital 46. Current ratio 47. Quick (acid-test) ratio Accounts receivable turnover 48. 49. Inventory turnover 50. Debt to equity ratio 51. Debt to assets ratio