

Question
Using Python: 1. 2. Part 1,2,3,4 and have been solved. Just need part 6. Feel free to see pictures for guidance. I cannot attach the
Using Python:
1.
2. Part 1,2,3,4 and have been solved. Just need part 6. Feel free to see pictures for guidance.
I cannot attach the entire csv but here's the top rows with column values for your reference.
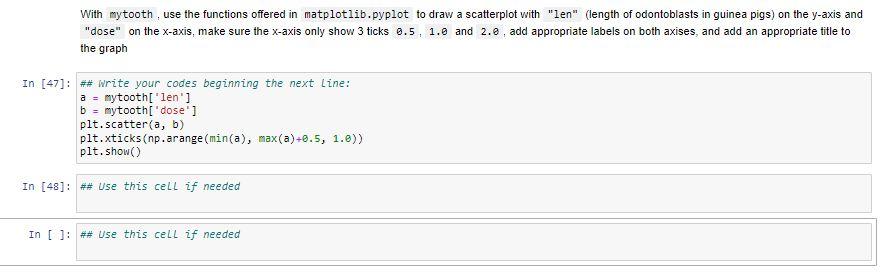
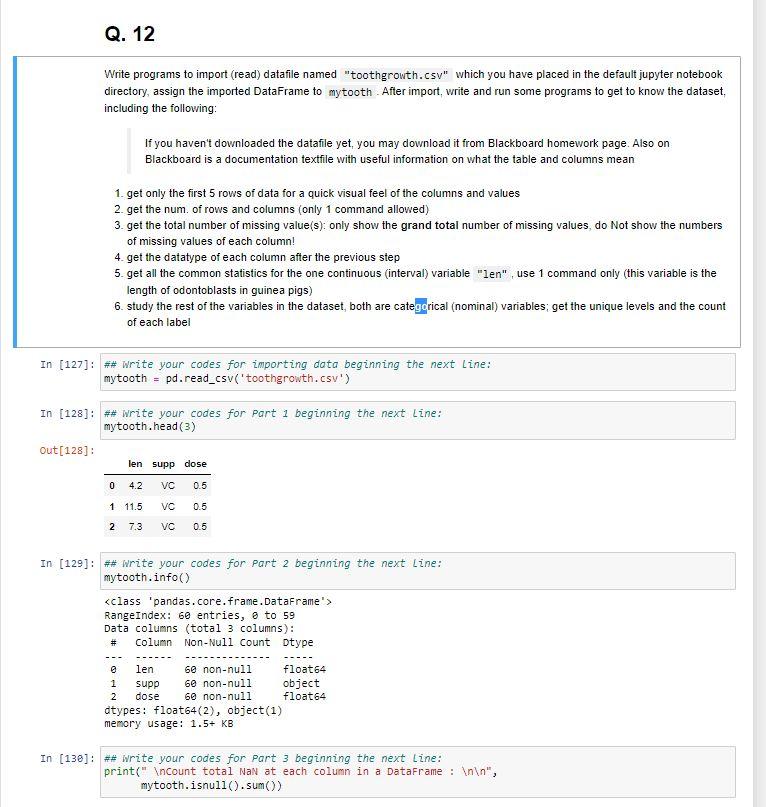
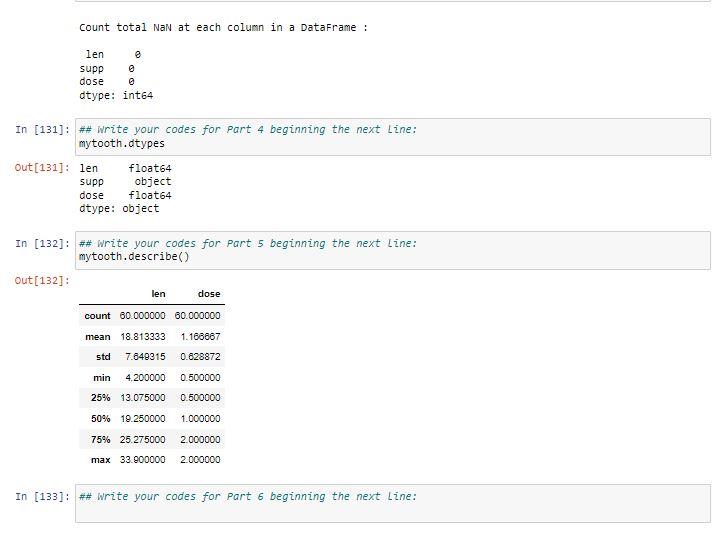
With mytooth, use the functions offered in matplotlib.pyplot to draw a scatterplot with "len" (length of odontoblasts in guinea pigs) on the y-axis and "dose" on the x-axis, make sure the x-axis only show 3 ticks 0.5,1.0 and 2.6 , add appropriate labels on both axises, and add an appropriate title to the graph [47]: \#\# write your codes beginning the next line: a mytooth['len'] b = mytooth['dose'] plt.scatter (a,b) plt.xticks(np.arange(min(a), max(a)+0.5,1.0)) plt. show() [48]: \#\# Use this cell if needed []: \#\# Use this cell if needed Write programs to import (read) datafile named "toothgrowth.csv" which you have placed in the default jupyter notebook directory, assign the imported DataFrame to mytooth. After import, write and run some programs to get to know the dataset, including the following: If you haven't downloaded the datafile yet, you may download it from Blackboard homework page. Also on Blackboard is a documentation textfile with useful information on what the table and columns mean 1. get only the first 5 rows of data for a quick visual feel of the columns and values 2. get the num. of rows and columns (only 1 command allowed) 3. get the total number of missing value(s): only show the grand total number of missing values, do Not show the numbers of missing values of each column! 4. get the datatype of each column after the previous step 5. get all the common statistics for the one continuous (interval) variable, use 1 command only (this variable is the length of odontoblasts in guinea pigs) 6. study the rest of the variables in the dataset, both are cate rical (nominal) variables; get the unique levels and the count of each label \# Write your codes for part 6 beginning the next Line: With mytooth, use the functions offered in matplotlib.pyplot to draw a scatterplot with "len" (length of odontoblasts in guinea pigs) on the y-axis and "dose" on the x-axis, make sure the x-axis only show 3 ticks 0.5,1.0 and 2.6 , add appropriate labels on both axises, and add an appropriate title to the graph [47]: \#\# write your codes beginning the next line: a mytooth['len'] b = mytooth['dose'] plt.scatter (a,b) plt.xticks(np.arange(min(a), max(a)+0.5,1.0)) plt. show() [48]: \#\# Use this cell if needed []: \#\# Use this cell if needed Write programs to import (read) datafile named "toothgrowth.csv" which you have placed in the default jupyter notebook directory, assign the imported DataFrame to mytooth. After import, write and run some programs to get to know the dataset, including the following: If you haven't downloaded the datafile yet, you may download it from Blackboard homework page. Also on Blackboard is a documentation textfile with useful information on what the table and columns mean 1. get only the first 5 rows of data for a quick visual feel of the columns and values 2. get the num. of rows and columns (only 1 command allowed) 3. get the total number of missing value(s): only show the grand total number of missing values, do Not show the numbers of missing values of each column! 4. get the datatype of each column after the previous step 5. get all the common statistics for the one continuous (interval) variable, use 1 command only (this variable is the length of odontoblasts in guinea pigs) 6. study the rest of the variables in the dataset, both are cate rical (nominal) variables; get the unique levels and the count of each label \# Write your codes for part 6 beginning the next LineStep by Step Solution
There are 3 Steps involved in it
Step: 1

Get Instant Access to Expert-Tailored Solutions
See step-by-step solutions with expert insights and AI powered tools for academic success
Step: 2

Step: 3
Ace Your Homework with AI
Get the answers you need in no time with our AI-driven, step-by-step assistance
Get Started
Seven NoSQL Databases In A Week Get Up And Running With The Fundamentals And Functionalities Of Seven Of The Most Popular NoSQL Databases
Authors: Aaron Ploetz ,Devram Kandhare ,Sudarshan Kadambi ,Xun Wu
1st Edition
1787288862, 978-1787288867