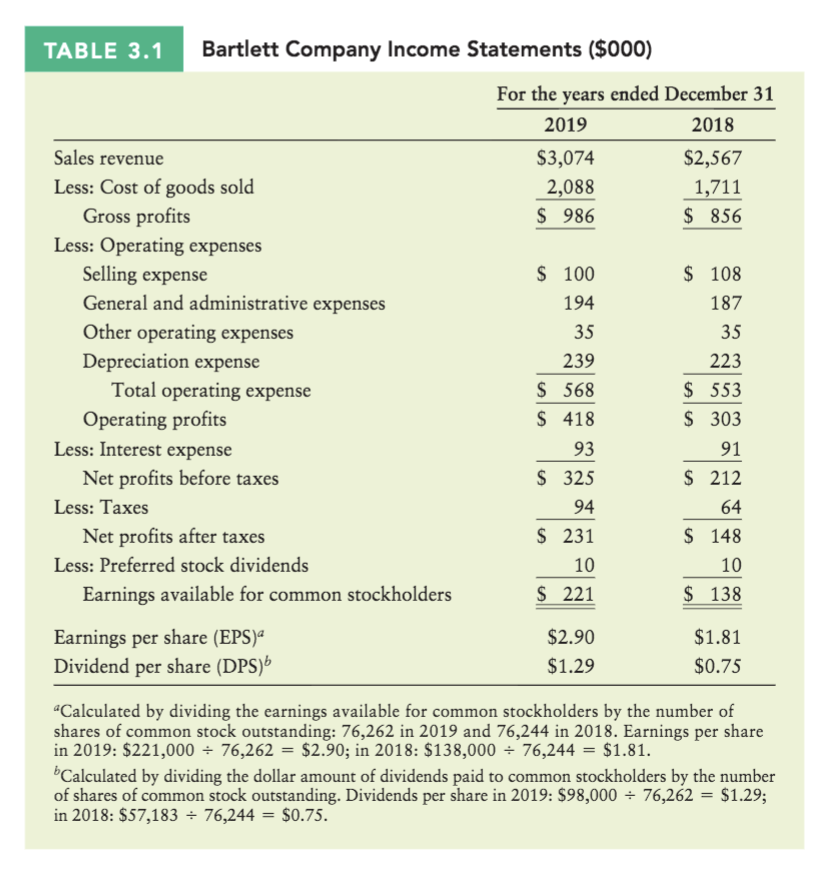
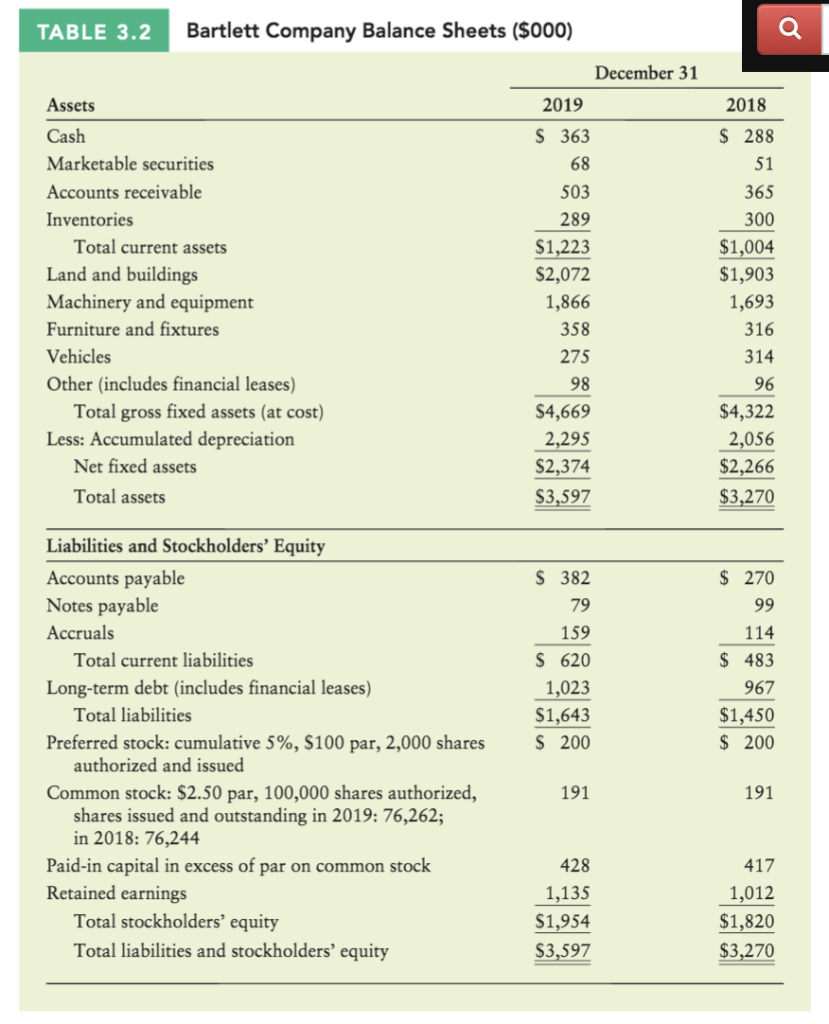
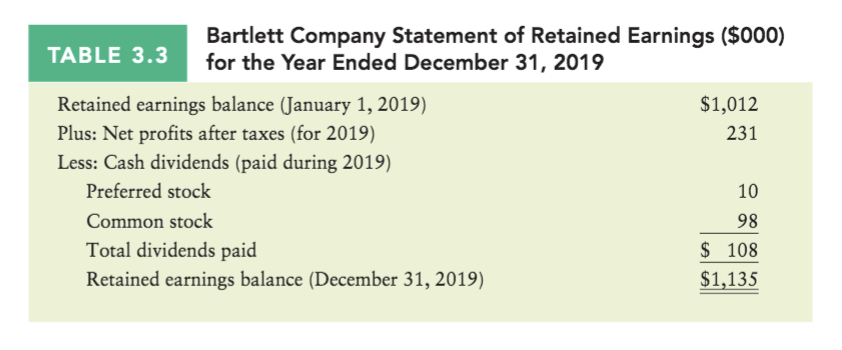
Using Tables 3.1, 3.2, and 3.3, conduct a complete ratio analysis of the Bartlett Company for the years 2018 and 2019. You should assess the firms liquidity, activity, debt, and profitability ratios. Highlight any particularly positive or negative developments that you uncover when comparing ratios from 2018 and 2019
.


TABLE 3.1 Bartlett Company Income Statements ($000) For the years ended December 31 2019 2018 $3,074 $2,567 2,088 1,711 $ 986 $ 856 $ 108 187 35 Sales revenue Less: Cost of goods sold Gross profits Less: Operating expenses Selling expense General and administrative expenses Other operating expenses Depreciation expense Total operating expense Operating profits Less: Interest expense Net profits before taxes Less: Taxes Net profits after taxes Less: Preferred stock dividends Earnings available for common stockholders $ 100 194 35 239 $ 568 $ 418 93 $ 325 223 $ 553 $ 303 91 $ 212 64 $ 148 10 $ 138 94 $ 231 10 $ 221 Earnings per share (EPS)a Dividend per share (DPS) $2.90 $1.29 $1.81 $0.75 hares of s2mimoon stor "Calculated by dividing the earnings available for common stockholders by the number of shares of common stock outstanding: 76,262 in 2019 and 76,244 in 2018. Earnings per share in 2019: $221,000 = 76,262 = $2.90; in 2018: $138,000 = 76,244 = $1.81. bCalculated by dividing the dollar amount of dividends paid to common stockholders by the number of shares of common stock outstanding. Dividends per share in 2019: $98,000 = 76,262 = $1.29; in 2018: $57,183 = 76,244 = $0.75. TABLE 3.2 Bartlett Company Balance Sheets ($000) Assets Cash Marketable securities Accounts receivable Inventories Total current assets Land and buildings Machinery and equipment Furniture and fixtures Vehicles Other (includes financial leases) Total gross fixed assets (at cost) Less: Accumulated depreciation Net fixed assets Total assets December 31 2019 $ 363 68 503 289 $1,223 $2,072 1,866 358 275 98 $4,669 2,295 $2,374 $3,597 2018 $ 288 51 365 300 $1,004 $1,903 1,693 316 314 96 $4,322 2,056 $2,266 $3,270 Liabilities and Stockholders' Equity Accounts payable Notes payable Accruals Total current liabilities Long-term debt (includes financial leases) Total liabilities Preferred stock: cumulative 5%, $100 par, 2,000 shares authorized and issued Common stock: $2.50 par, 100,000 shares authorized, shares issued and outstanding in 2019: 76,262; in 2018: 76,244 Paid-in capital in excess of par on common stock Retained earnings Total stockholders' equity Total liabilities and stockholders' equity $ 382 79 159 $ 620 1,023 $1,643 $ 200 $ 270 99 114 $ 483 967 $1,450 $ 200 191 191 428 1,135 $1,954 $3,597 417 1,012 $1,820 $3,270 TABLE 3.3 Bartlett Company Statement of Retained Earnings ($000) for the Year Ended December 31, 2019 $1,012 231 Retained earnings balance (January 1, 2019) Plus: Net profits after taxes (for 2019) Less: Cash dividends (paid during 2019) Preferred stock Common stock Total dividends paid Retained earnings balance (December 31, 2019) $ 108 $1,135


