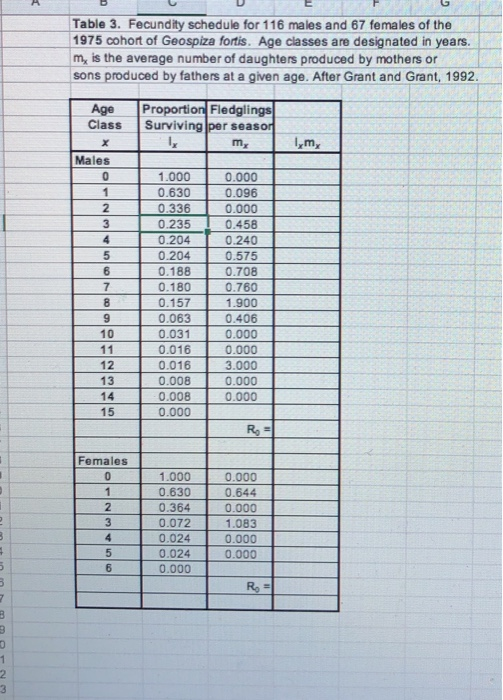
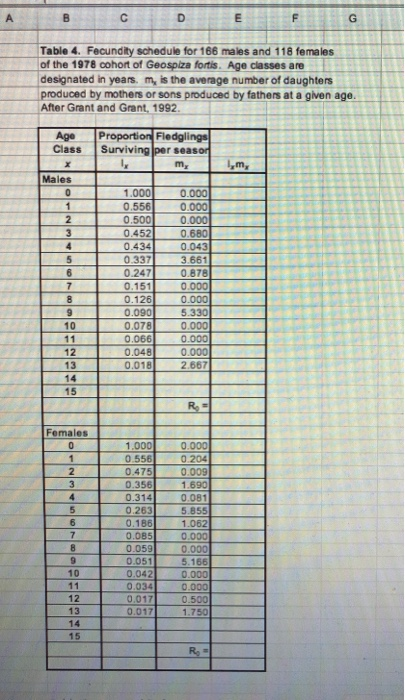
Using the column marked l xm x in Tables 3 and 4, calculate the net reproductive rate, R 0, for males and females separately for both the 1975 and 1978 cohorts. Do this by multiplying the proportion surviving (l x) by the age-specific fecundity (m x) for each individual age class and then summing those values over all age classes.
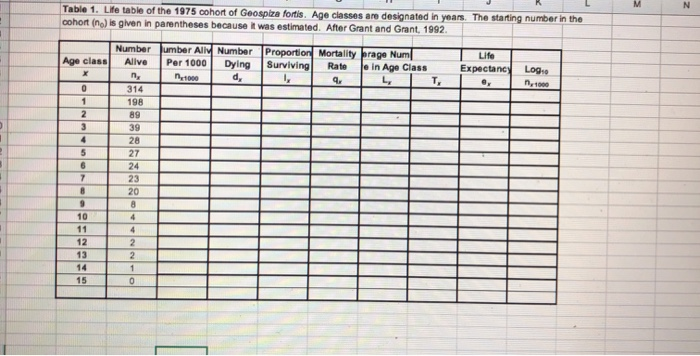
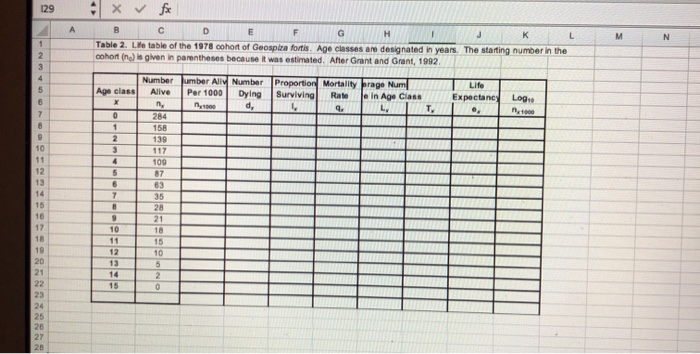
Table 1. Le table of the 1975 cohort of Geospiza fortis. Age classes are designated in years. The starting number in the cohort (n) is given in parentheses because I was estimated. After Grant and Grant, 1992. Age class Life Expectancy , Log Number umber Ally Number Proportion Mortality prage Num Alive Per 1000 Dying Surviving Rate Join Age Class L L , IT, 314 198 89 ATTI ATT TT ATT x V fx C D E F I J K L Table 2. Lite table of the 1978 cohort of Geospira fortis Age classes are designated in years. The starting number in the cohortin) is given in parentheses because I was estimated. After Grant and Grant, 1992 Number Jumber Ally Number Alive Per 1000 Dying ny d, Proportion Mortality rage Num Surviving Rate le in Age Class L T L ife Expectancy Log , TT 6 Table 3. Fecundity schedule for 116 males and 67 females of the 1975 cohort of Geospiza fortis. Age classes are designated in years. m, is the average number of daughters produced by mothers or sons produced by fathers at a given age. After Grant and Grant, 1992. Age Class Proportion Fledglings Surviving Jper season m, 1 lm, TI LONDON 1.000 0.630 0.336 0.235 0.204 0.204 0.188 0.180 0.157 0.063 0.031 0.016 0.016 0.008 0.008 0.000 0.000 0.096 0.000 0.458 0.240 0.575 0.708 0.760 1.900 0.406 0.000 T 0.000 3.000 0.000 0.000 14 15 R = Females 2 1.000 0.630 0.364 0.072 0.024 0.024 .000 0.000 0.644 0.000 1.083 0.000 000 0.000 5 6 0 R = Table 4. Fecundity schedule for 166 males and 118 females of the 1978 cohort of Geospiza fortis. Age classes are designated in years, m, is the average number of daughters produced by mothers or sons produced by fathers at a given age. After Grant and Grant, 1992 Age Proportion Fledglings Class Surviving per seasod my Males 1.000 0.000 0.556 0.000 0.5000.000 0.452 0.680 0.434 0.043 0.337 3.661 0.247 0.878 0.1510 .000 0.1260 .000 0.090 5.330 10 0.078 0.000 0.066 0.000 0.0480 .000 113 0.018 2.667 14 15 TRT NI EL IIIIIIIIII Females 0 1 2 3 1 0 0 .000 0.000 .556 0.204 .475 0.009 0.356 1.690 0.314 0.081 0.263 5.855 0.186 1.062 0.0850.000 0.0590.000 0.0515.166 0.0420.000 0.034 0.000 0.0170.500 0.017 1.750 15 TR