

Answered step by step
Verified Expert Solution
Question
1 Approved Answer
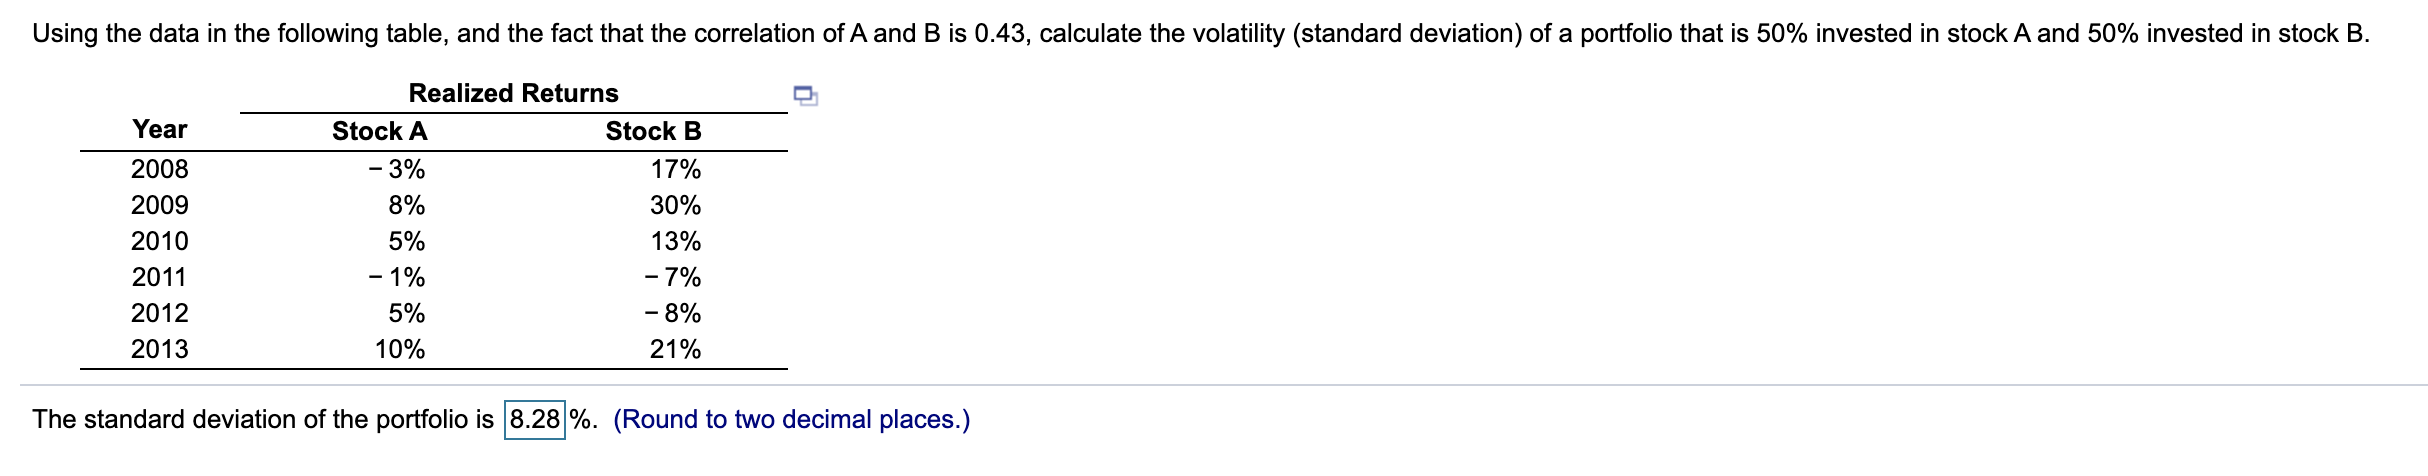
Using the data in the following table, and the fact that the correlation of A and B is 0.43, calculate the volatility (standard deviation) of
Step by Step Solution
There are 3 Steps involved in it
Step: 1

Get Instant Access to Expert-Tailored Solutions
See step-by-step solutions with expert insights and AI powered tools for academic success
Step: 2

Step: 3
Ace Your Homework with AI
Get the answers you need in no time with our AI-driven, step-by-step assistance
Get Started
The Illiterate Executive An Executives Handbook For Mastering Financial Acumen
Authors: Blair Cook
1st Edition
1460289935, 978-1460289938