

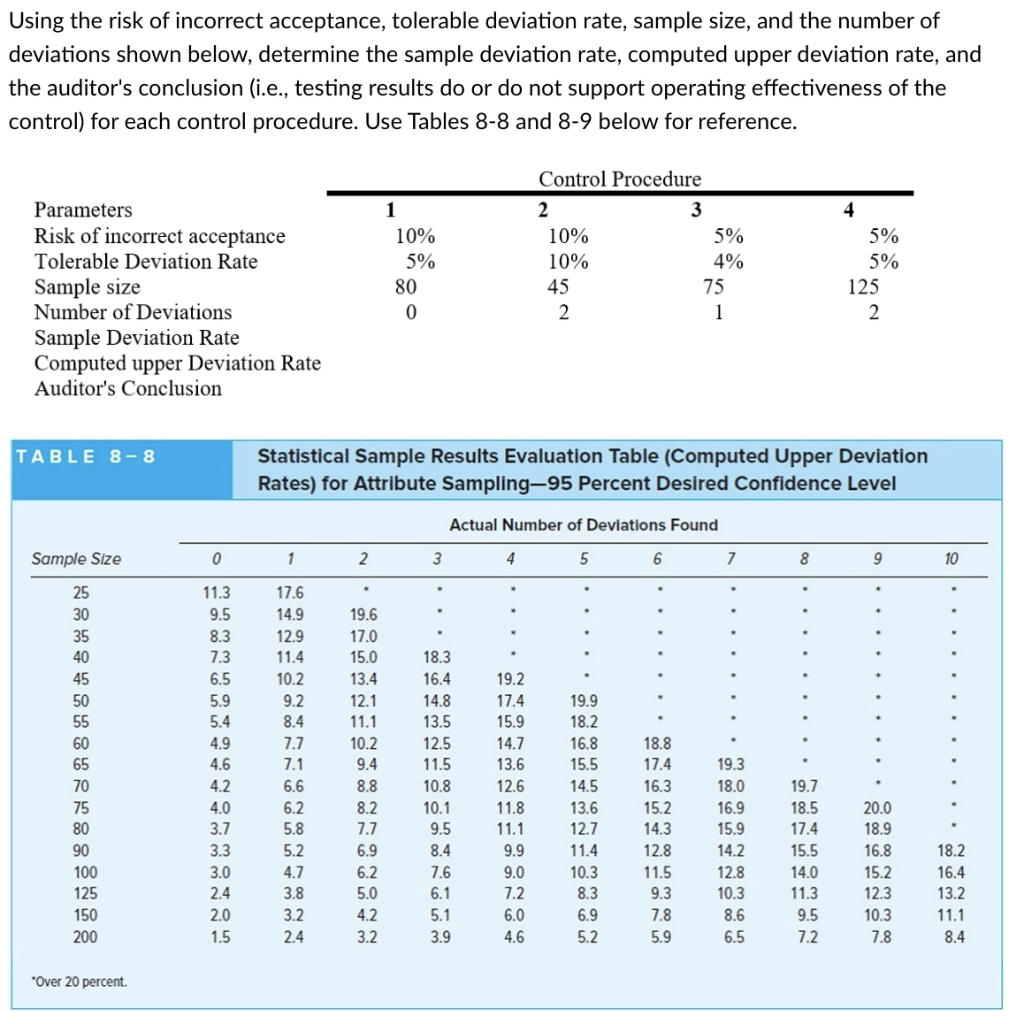
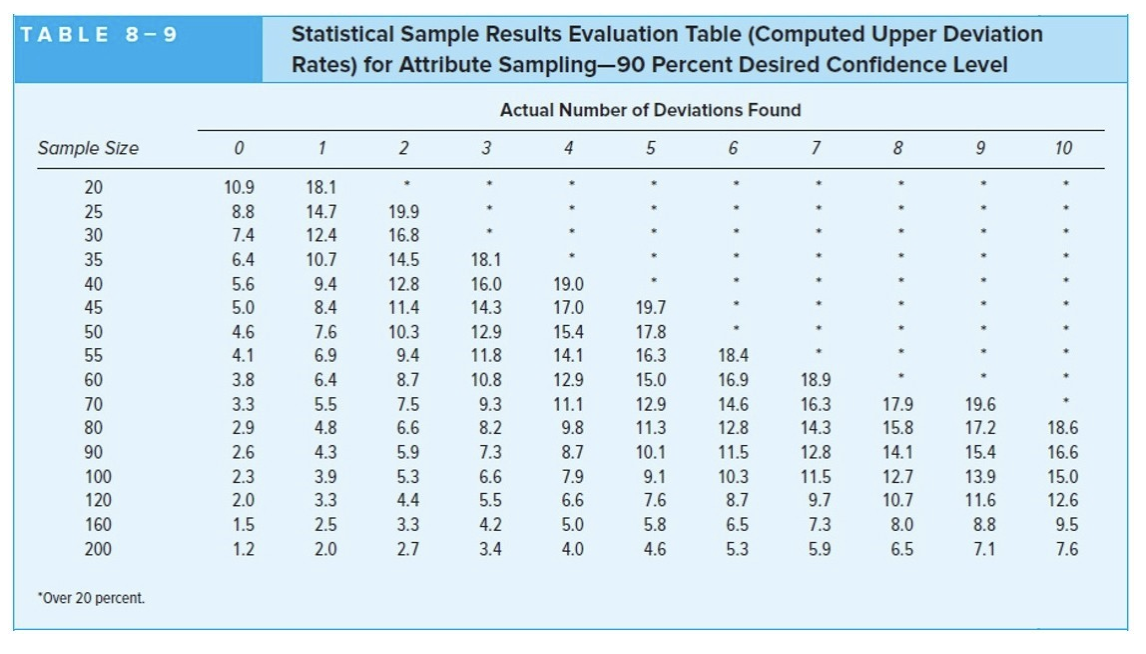
Using the risk of incorrect acceptance, tolerable deviation rate, sample size, and the number of deviations shown below, determine the sample deviation rate, computed upper deviation rate, and the auditor's conclusion (i.e., testing results do or do not support operating effectiveness of the control) for each control procedure. Use Tables 8-8 and 8-9 below for reference. Parameters Risk of incorrect acceptance Tolerable Deviation Rate Sample size Number of Deviations Sample Deviation Rate Computed upper Deviation Rate Auditor's Conclusion 1 10% 5% 80 0 4 5% 5% 125 Control Procedure 2 3 10% 5% 10% 4% 45 75 2 1 TABLE 8-8 Statistical Sample Results Evaluation Table (Computed Upper Deviation Rates) for Attribute Sampling-95 Percent Desired Confidence Level Actual Number of Deviations Found Sample Size 0 1 2 3 4 5 6 7 8 9 10 . 19.6 25 30 35 40 45 17.0 18.3 16.4 19.2 15.0 13.4 12.1 11.1 10.2 14.8 17.4 55 60 19.9 18.2 16.8 11.3 9.5 8.3 7.3 6.5 5.9 5.4 4.9 4.6 4.2 4.0 3.7 3.3 3.0 2.4 2.0 1.5 17.6 14.9 12.9 11.4 10.2 9.2 8.4 7.7 7.1 6.6 6.2. 5.8 5.2 4.7 3.8 3.2 2.4 15.5 19.3 8.8 14.5 13.6 70 75 80 90 100 125 150 200 nnns88 7.7 6.9 6.2. 5.0 4.2 3.2 12.7 13.5 12.5 11.5 10.8 10.1 9.5 8.4 7.6 6.1 5.1 3.9 24829 15.9 14.7 13.6 12.6 11.8 11.1 9.9 9.0 7.2 6.0 4.6 18.8 17.4 16.3 15.2 14.3 12.8 11.5 9.3 7.8 5.9 11.4 10.3 8.3 6.9 5.2 18.0 16.9 15.9 14.2 12.8 10.3 8.6 6.5 19.7 18.5 17.4 15.5 14.0 11.3 9.5 7.2 20.0 18.9 16.8 15.2 12.3 10.3 7.8 18.2 16.4 13.2 11.1 8.4 "Over 20 percent. TABLE 8-9 Statistical Sample Results Evaluation Table (Computed Upper Deviation Rates) for Attribute Sampling-90 Percent Desired Confidence Level Actual Number of Deviations Found Sample Size 0 1 2 3 4 5 6 7 8 9 10 O ON 20 25 30 35 40 45 50 55 60 70 80 90 100 120 160 200 10.9 8.8 7.4 6.4 5.6 5.0 4.6 4.1 3.8 3.3 2.9 2.6 2.3 2.0 1.5 1.2 18.1 14.7 12.4 10.7 9.4 8.4 7.6 6.9 6.4 5.5 4.8 4.3 3.9 3.3 2.5 2.0 19.9 16.8 14.5 12.8 11.4 10.3 9.4 8.7 7.5 6.6 5.9 5.3 4.4 3.3 2.7 18.1 16.0 14.3 12.9 11.8 10.8 9.3 8.2 7.3 6.6 5.5 4.2 3.4 19.0 17.0 15.4 14.1 12.9 11.1 9.8 8.7 7.9 6.6 5.0 4.0 19.7 17.8 16.3 15.0 12.9 11.3 10.1 9.1 7.6 5.8 4.6 17.9 15.8 14.1 18.4 16.9 14.6 12.8 11.5 10.3 8.7 6.5 5.3 18.9 16.3 14.3 12.8 11.5 9.7 7.3 5.9 12.7 19.6 17.2 15.4 13.9 11.6 8.8 7.1 18.6 16.6 15.0 12.6 9.5 7.6 000 10.7 8.0 6.5 "Over 20 percent