

Answered step by step
Verified Expert Solution
Question
1 Approved Answer
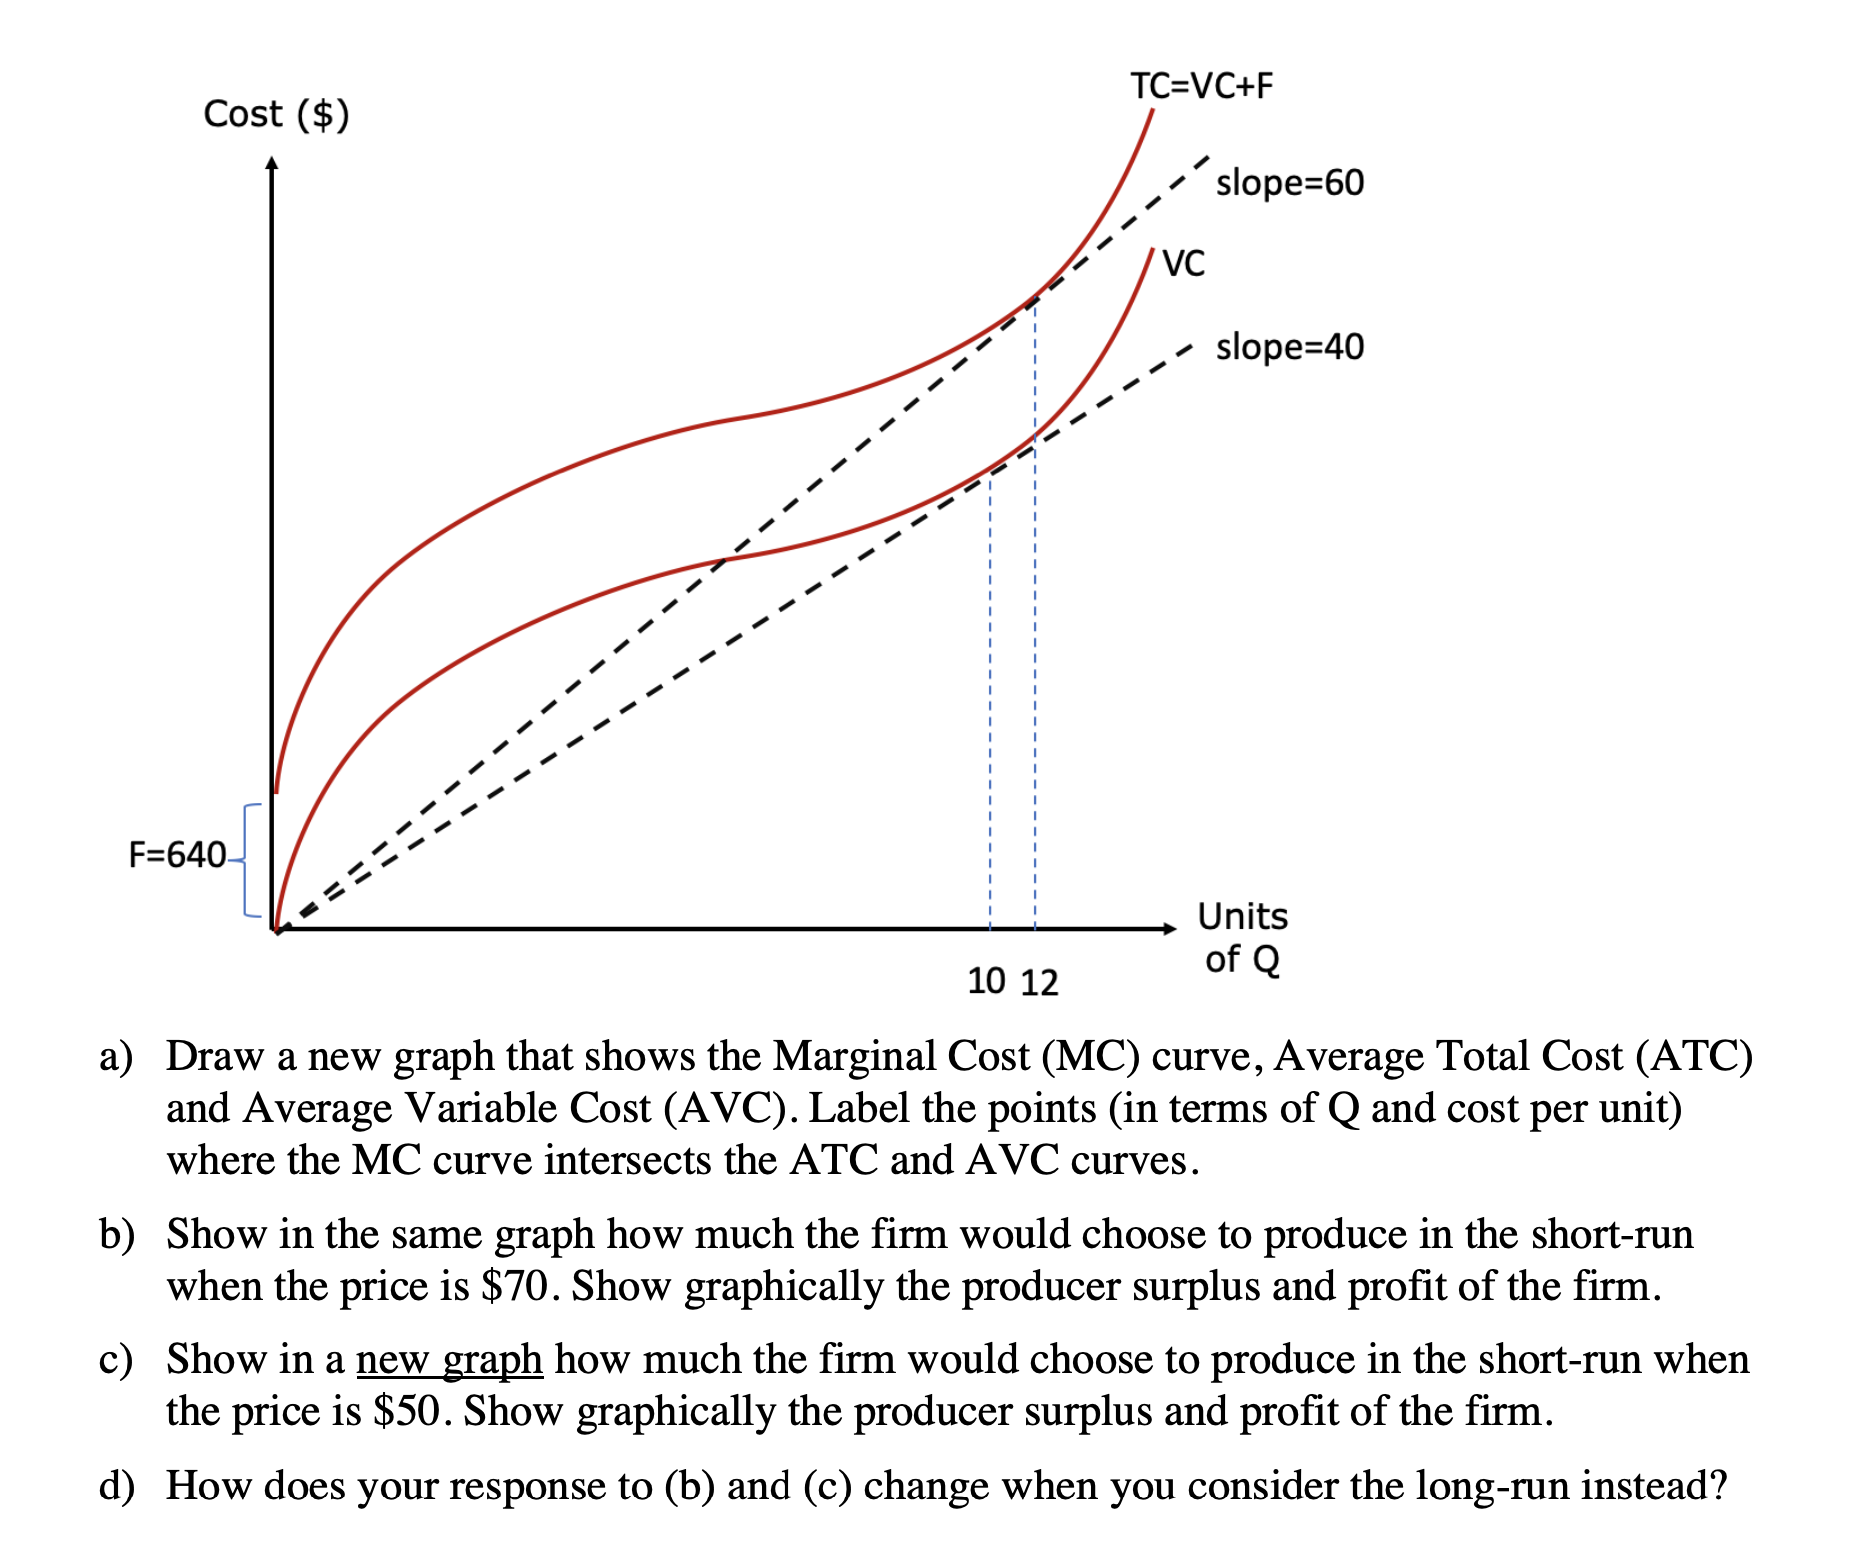
VC Units 10 12 f Q Draw a new graph that shows the Marginal Cost (MC) curve, Average Total Cost (ATC) and Average Variable Cost
Step by Step Solution
There are 3 Steps involved in it
Step: 1

Get Instant Access to Expert-Tailored Solutions
See step-by-step solutions with expert insights and AI powered tools for academic success
Step: 2

Step: 3
Ace Your Homework with AI
Get the answers you need in no time with our AI-driven, step-by-step assistance
Get Started
Lectures On Urban Economics
Authors: Jan K Brueckner
1st Edition
0262300311, 9780262300315