vertical analysis and return on assets and the return on common stockholders'
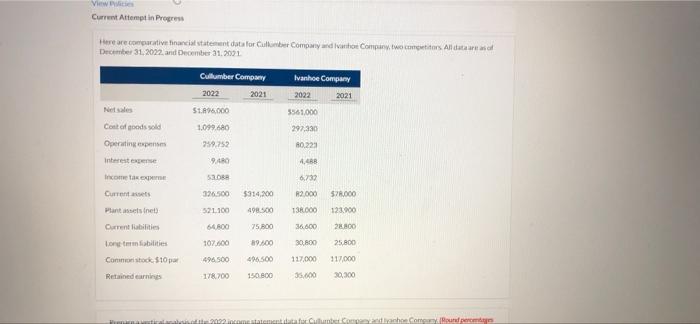
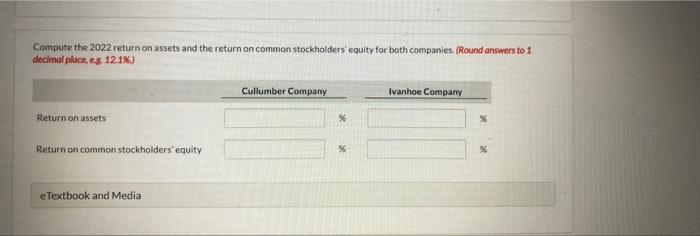
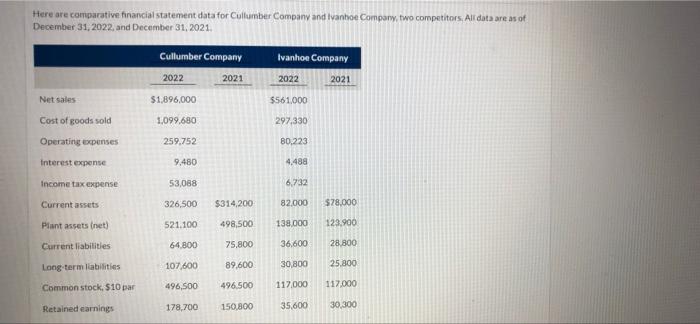
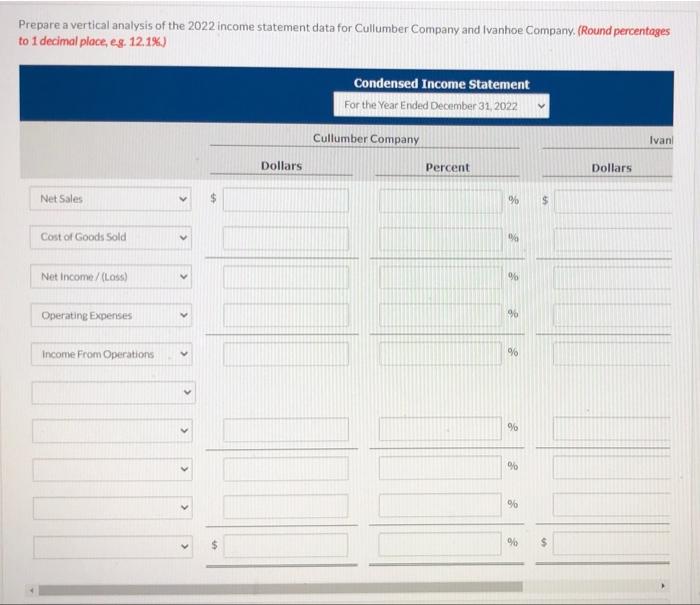
View Current Attemptin Progress Here are cominciate data for Cullber Company and the Company. Its All data December 31, 2022 and December 31, 2021 Ivanhoe Company 2022 2021 Net sales Cullumber Company 2022 2021 $1.296.000 1.099.680 759,252 3561.000 297,330 Cont of goods sold Operating expens 80.223 9.480 4.488 Increase 53.0 6.733 326,500 $314.200 R2.000 57.000 52100 498.500 138.000 123.900 64.800 75.00 36.600 2.800 Pantsetsnet) Current abilities Lorem abilities Commstock $10 pa Retained earnings 107.000 89.00 30.800 25.800 496 500 406 500 117.000 117,000 18.00 150 000 35.600 30,300 2022 income tantemente anche come und Carded income Statement CC Dollar Per bullon Compute the 2022 return on assets and the return on common stockholders' equity for both companies. (Round answers to 1 decimal place, e.g. 12.1%) Cullumber Company Ivanhoe Company Return on assets % % Return on common stockholders' equity % %6 eTextbook and Media Here are comparative financial statement data for Cullumber Company and Ivanhoe Company. two competitors. All data areas of December 31, 2022, and December 31, 2021 Cullumber Company Ivanhoe Company 2022 2021 2022 2021 Net sales $1,896,000 $561.000 Cost of goods sold 1,099.680 297.330 Operating expenses 259.752 80.223 Interest expense 9.480 4.488 Income tax expense 53,088 6,732 Current assets 326,500 $314,200 82.000 $78,000 Plant assets net) 521.100 498,500 138.000 123.900 Current liabilities 64.800 75.800 36,600 28.800 Long-term liabilities 107,600 89,600 30,800 25,800 496,500 Common stock. $10 par 496.500 117.000 117,000 Retained earnings 178,700 150,800 35,600 30,300 Prepare a vertical analysis of the 2022 income statement data for Cullumber Company and Ivanhoe Company. (Round percentages to 1 decimal place, eg. 12.1%) Condensed Income Statement For the Year Ended December 31, 2022 Cullumber Company Ivan Dollars Percent Dollars Net Sales Net Income /(Loss) % 96 Operating Expenses 90 > %