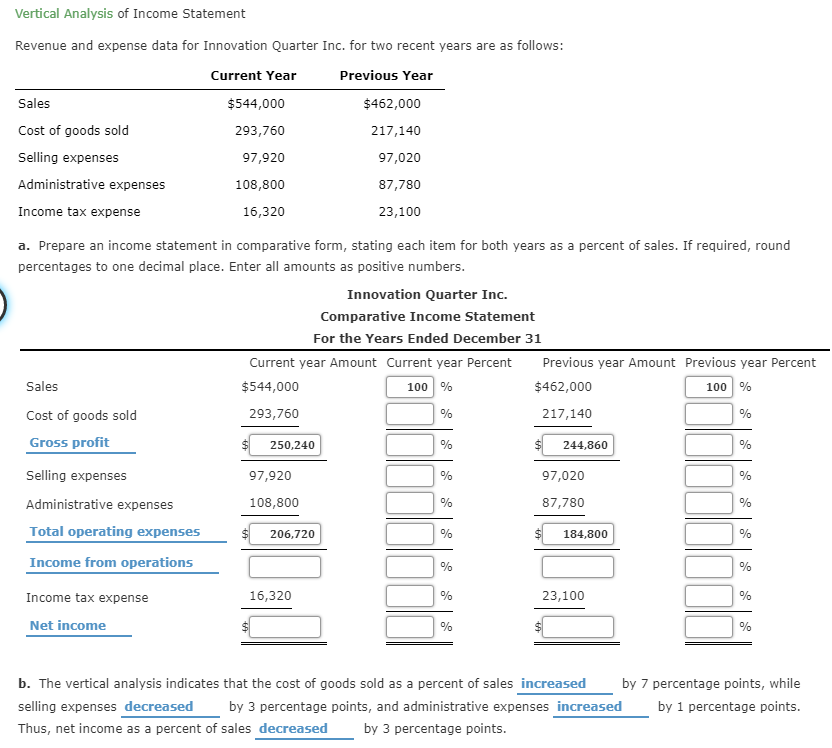
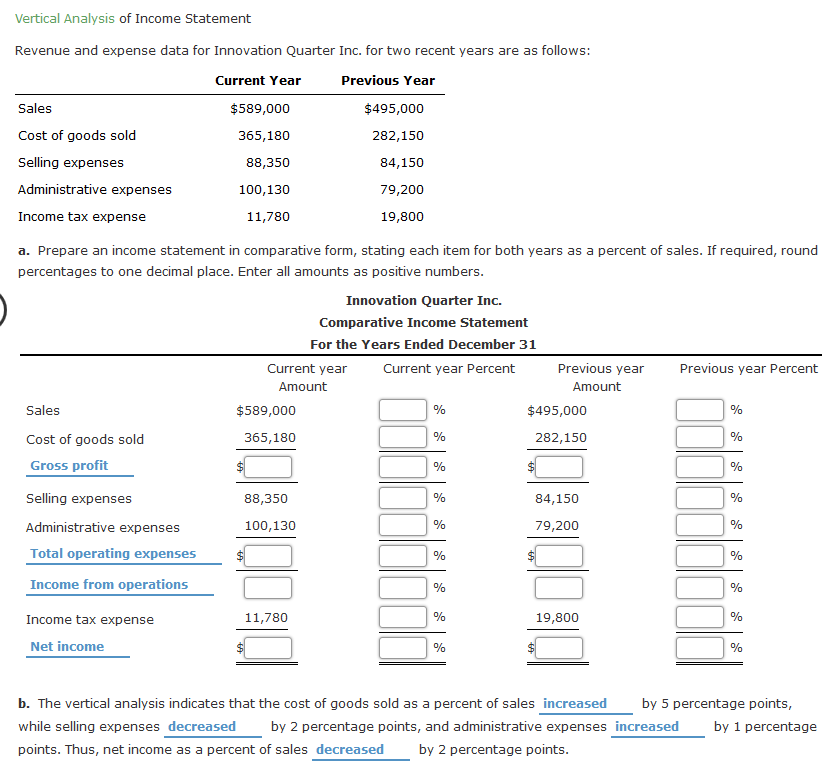
Vertical Analysis of Income Statement Revenue and expense data for Innovation Quarter Inc. for two recent years are as follows: Current Year Previous Year Sales $544,000 $462,000 Cost of goods sold 293,760 217,140 Selling expenses 97,920 97,020 Administrative expenses 108,800 87,780 Income tax expense 16,320 23,100 a. Prepare an income statement in comparative form, stating each item for both years as a percent of sales. If required, round percentages to one decimal place. Enter all amounts as positive numbers. Innovation Quarter Inc. Comparative Income Statement For the Years Ended December 31 Current year Amount Current year Percent Previous year Amount Previous year Percent Sales $544,000 100 % $462,000 100 % Cost of goods sold 293,760 % 217,140 Gross profit % % Selling expenses 97,920 97,020 Administrative expenses 108,800 % 87,780 Total operating expenses 206,720 Income from operations % 250,240 244,860 % % % % 184,800 % % % 16,320 % 23,100 % Income tax expense Net income % % b. The vertical analysis indicates that the cost of goods sold as a percent of sales increased by 7 percentage points, while selling expenses decreased by 3 percentage points, and administrative expenses increased by 1 percentage points. Thus, net income as a percent of sales decreased by 3 percentage points. Vertical Analysis of Income Statement Revenue and expense data for Innovation Quarter Inc. for two recent years are as follows: Current Year Previous Year Sales $589,000 $495,000 Cost of goods sold 365,180 282,150 Selling expenses 88,350 84,150 Administrative expenses 100,130 79,200 Income tax expense 11,780 19,800 a. Prepare an income statement in comparative form, stating each item for both years as a percent of sales. If required, round percentages to one decimal place. Enter all amounts as positive numbers. Innovation Quarter Inc. Comparative Income Statement For the Years Ended December 31 Current year Current year Percent Previous year Previous year Percent Amount Amount Sales $589,000 % $495,000 % 365,180 % 282,150 % Cost of goods sold Gross profit % % 88,350 % 84,150 % 100,130 % 79,200 % Selling expenses Administrative expenses Total operating expenses Income from operations % % % % 11,780 % 19,800 % Income tax expense Net income % % b. The vertical analysis indicates that the cost of goods sold as a percent of sales increased by 5 percentage points, while selling expenses decreased by 2 percentage points, and administrative expenses increased by 1 percentage points. Thus, net income as a percent of sales decreased by 2 percentage points