

Answered step by step
Verified Expert Solution
Question
1 Approved Answer
View Policies Current Attempt in Progress Selected hypothetical comparative statement data for the giant bookseller Barnes & Noble are presented here. All balance sheet data
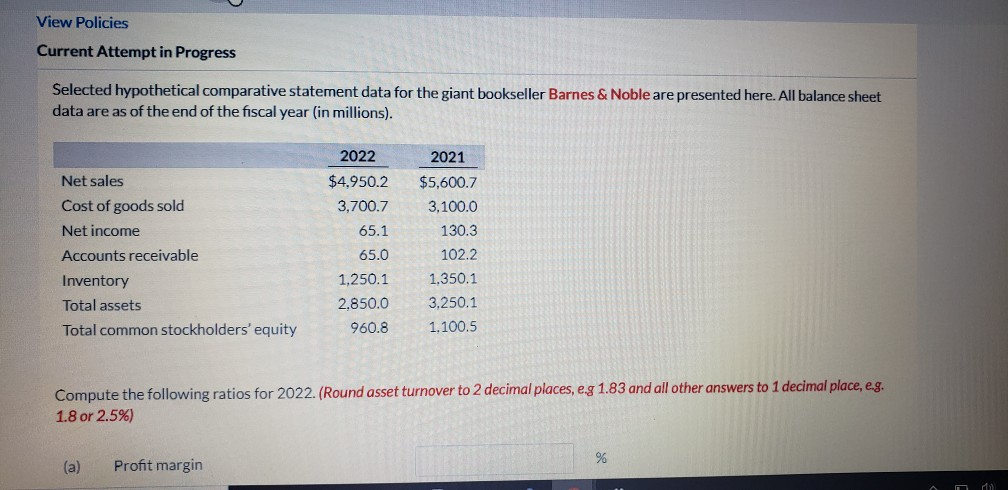
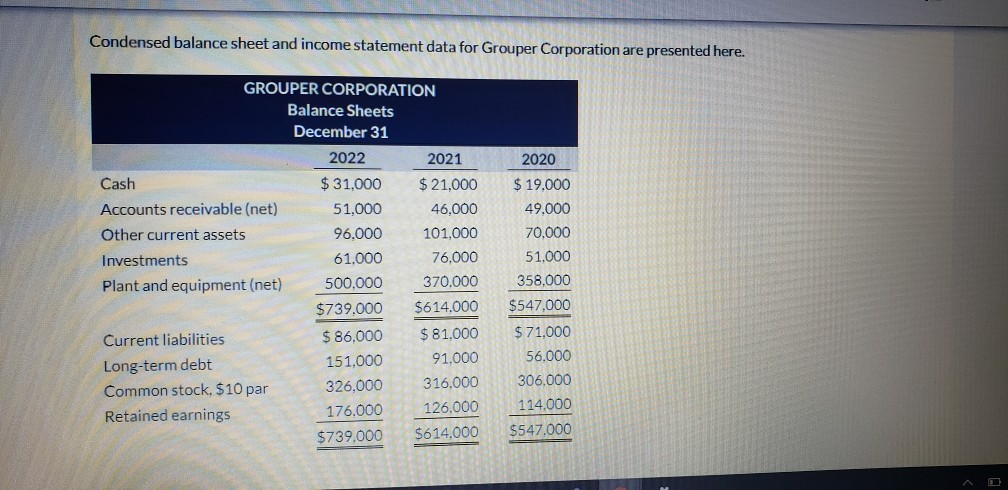
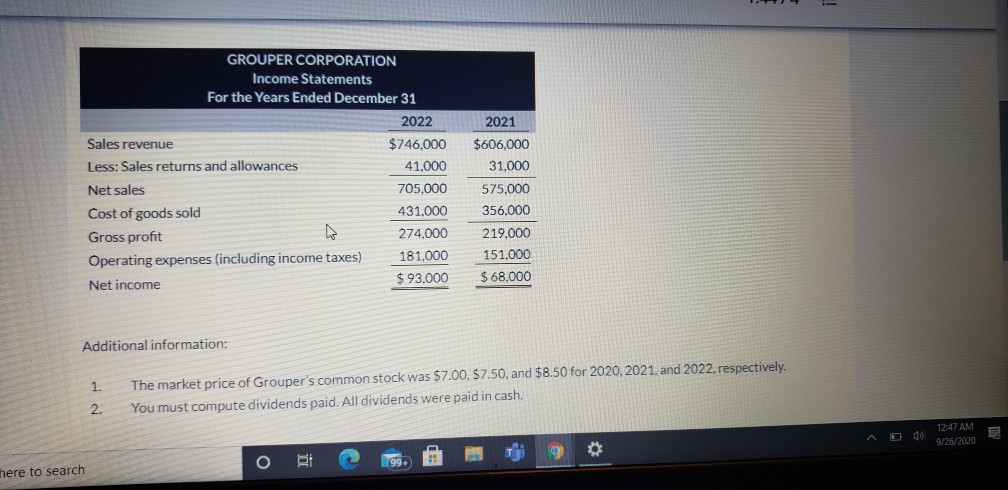
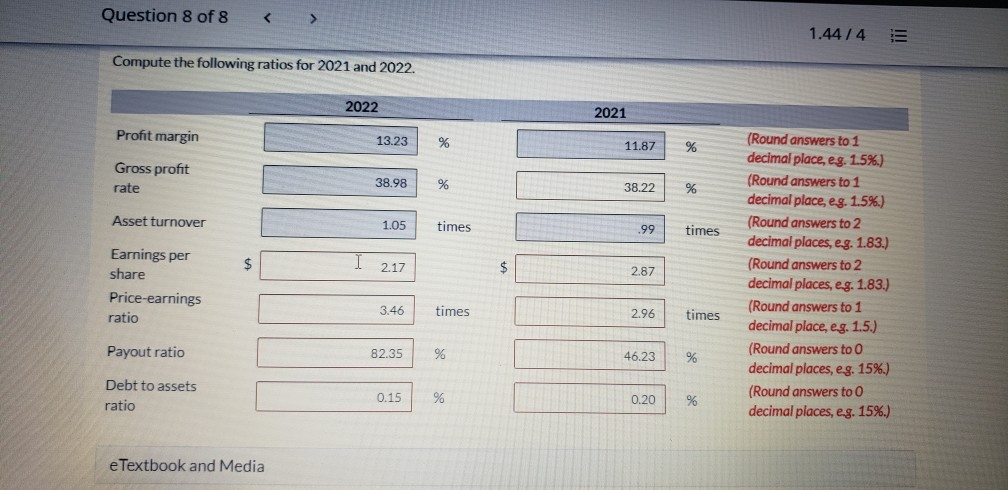
View Policies Current Attempt in Progress Selected hypothetical comparative statement data for the giant bookseller Barnes & Noble are presented here. All balance sheet data are as of the end of the fiscal year (in millions). 2022 $4.950.2 3,700.7 65.1 Net sales Cost of goods sold Net income Accounts receivable Inventory Total assets Total common stockholders' equity 2021 $5,600.7 3,100.0 130.3 102.2 1.350.1 3.250.1 1.100.5 65.0 1,250.1 2.850.0 960.8 Compute the following ratios for 2022. (Round asset turnover to 2 decimal places, e.g 1.83 and all other answers to 1 decimal place, e.g. 1.8 or 2.5%) % (a) Profit margin Condensed balance sheet and income statement data for Grouper Corporation are presented here. 2020 GROUPER CORPORATION Balance Sheets December 31 2022 2021 Cash $ 31,000 $ 21,000 Accounts receivable (net) 51,000 46,000 Other current assets 96.000 101,000 Investments 61.000 76.000 Plant and equipment (net) 500.000 370.000 $739.000 $614.000 Current liabilities $ 86,000 $ 81.000 Long-term debt 151,000 91,000 Common stock. $10 par 326.000 316.000 Retained earnings 176.000 126.000 $739.000 $614.000 $ 19.000 49,000 70.000 51.000 358,000 $547,000 $ 71.000 56.000 306.000 114.000 $547.000 2021 $606,000 31,000 GROUPER CORPORATION Income Statements For the Years Ended December 31 2022 Sales revenue $746,000 Less: Sales returns and allowances 41.000 Net sales 705,000 Cost of goods sold 431,000 Gross profit W 274,000 Operating expenses (including income taxes) 181,000 Net income $ 93.000 575,000 356.000 219.000 151.000 $ 68,000 Additional information: 1. 2. The market price of Grouper's common stock was $7.00. $7.50, and $8.50 for 2020, 2021, and 2022, respectively. You must compute dividends paid. All dividends were paid in cash. do 12:47 AM 9/26/2020 o here to search Question 8 of 8 1.44/4 Compute the following ratios for 2021 and 2022. 2022 2021 Profit margin 13.23 % 11.87 % Gross profit rate 38.98 % 38.22 % Asset turnover 1.05 times 99 times $ I 2.17 $ 2.87 Earnings per share Price-earnings ratio (Round answers to 1 decimal place, eg. 1.5%.) (Round answers to 1 decimal place, eg. 1.5%.) (Round answers to 2 decimal places, eg. 1.83.) (Round answers to 2 decimal places, eg. 1.83.) (Round answers to 1 decimal place, eg. 1.5.) (Round answers to O decimal places, eg. 15%.) (Round answers to O decimal places, e.g. 15%.) 3.46 times 2.96 times Payout ratio 82.35 % 46.23 % Debt to assets ratio 0.15 % 0.20 % e Textbook and Media
Step by Step Solution
There are 3 Steps involved in it
Step: 1

Get Instant Access to Expert-Tailored Solutions
See step-by-step solutions with expert insights and AI powered tools for academic success
Step: 2

Step: 3
Ace Your Homework with AI
Get the answers you need in no time with our AI-driven, step-by-step assistance
Get Started
An Audit Tool For Warfarin Therapy
Authors: Fatema Nuzhat, Malik Hasmat
1st Edition
3659426458, 978-3659426452