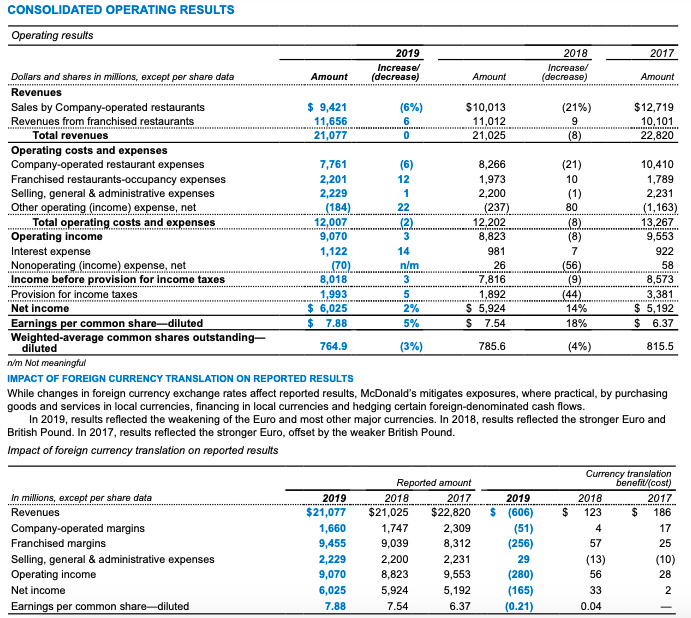
What are McDonald's revenue growth, equity trends, and debt rates for 2019?
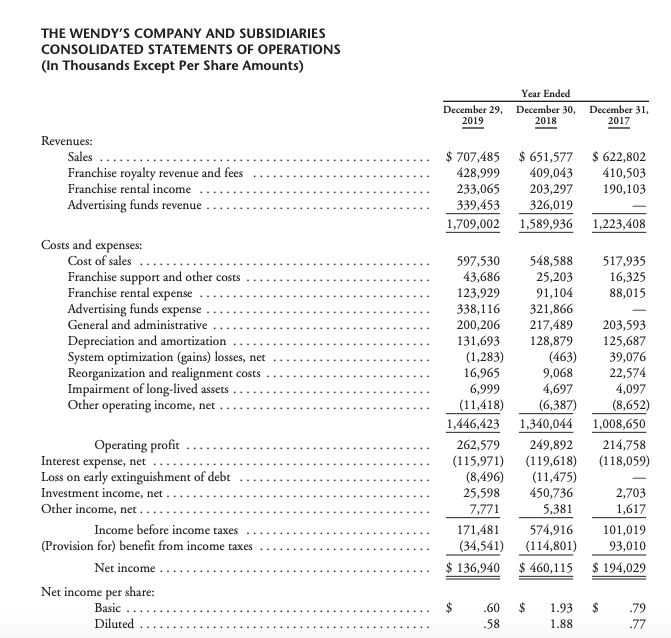
How does this compare to Wendy's?


CONSOLIDATED OPERATING RESULTS (184) (1,163) Operating results 2019 2018 2017 Increased Increase/ Dollars and shares in millions, except per share data Amount (decrease) Amount Idecrease) Amount Revenues Sales by Company-operated restaurants $ 9,421 $10,013 (21%) $12,719 Revenues from franchised restaurants 11,656 11,012 10,101 Total revenues 21,077 21,025 22,820 Operating costs and expenses Company-operated restaurant expenses 7,761 8.266 10,410 Franchised restaurants-occupancy expenses 2,201 1,973 1,789 Selling, general & administrative expenses 2,229 2,200 2,231 Other operating (income) expense, net (237) Total operating costs and expenses 12,007 12,202 13,267 Operating income 9,070 8,823 9,553 Interest expense 1,122 922 Nonoperating (income) expense, net 26 Income before provision for income taxes 8,018 7,816 8,573 Provision for income taxes 1,993 1,892 (44) 3.381 Net income 6,025 $ 5,924 14% $ 5,192 Earnings per common share-diluted 7.88 $ 7.54 18% $ 6.37 Weighted average common shares outstanding- diluted 764.9 785.6 (4%) 815.5 n/m Not meaningful IMPACT OF FOREIGN CURRENCY TRANSLATION ON REPORTED RESULTS While changes in foreign currency exchange rates affect reported results, McDonald's mitigates exposures, where practical, by purchasing goods and services in local currencies, financing in local currencies and hedging certain foreign-denominated cash flows. In 2019, results reflected the weakening of the Euro and most other major currencies. In 2018, results reflected the stronger Euro and British Pound. In 2017, results reflected the stronger Euro, offset by the weaker British Pound. Impact of foreign currency translation on reported results 981 (70) 58 (3%) Currency translation benefit/(cost) 2018 2017 123 186 2019 (606) (51) (256) Reported amount 2018 2017 $21,025 $22,820 1,747 2,309 9,039 8,312 2,200 2,231 8,823 9,553 5,924 5,192 7.54 6.37 In millions, except per share data Revenues Company-operated margins Franchised margins Selling, general & administrative expenses Operating income Net income Earnings per common share-diluted 57 2019 $21,077 1,660 9,455 2,229 9,070 6,025 7.88 29 (13) (280) (165) (0.21) 0.04 THE WENDY'S COMPANY AND SUBSIDIARIES CONSOLIDATED STATEMENTS OF OPERATIONS (In Thousands Except Per Share Amounts) Year Ended December 29, December 30, December 31, 2019 2018 2017 Revenues: Sales .. Franchise royalty revenue and fees ...... Franchise rental income Advertising funds revenue ......... $ 707,485 428,999 233,065 339,453 1,709,002 $ 651,577 409,043 203,297 326,019 1,589,936 $622,802 410,503 190,103 1,223,408 517,935 16,325 88,015 Costs and expenses: Cost of sales ...... Franchise support and other costs ........ Franchise rental expense ... Advertising funds expense .. General and administrative ....... Depreciation and amortization ........... System optimization (gains) losses, net ......... Reorganization and realignment costs. Impairment of long-lived assets ..... Other operating income, net .......... 597,530 43,686 123,929 338,116 200,206 131,693 (1,283) 16,965 6,999 (11,418) 1,446,423 262,579 (115,971) (8,496) 25,598 7,771 171,481 (34,541) $ 136,940 548,588 25,203 91,104 321,866 217,489 128,879 (463) 9,068 4,697 (6,387) 1,340,044 249,892 (119,618) (11,475) 450,736 5,381 574,916 (114,801) $ 460,115 203,593 125,687 39,076 22,574 4,097 (8,652) 1,008,650 214,758 (118,059) Operating profit ................. Interest expense, net Loss on early extinguishment of debt .... Investment income, net ... Other income, net ... Income before income taxes ............ (Provision for) benefit from income taxes ....... Net income .......................... Net income per share: 2,703 1,617 101,019 93,010 $ 194,029 Basic ... ......... $ .60 58 $ 1.93 1.88 $ 79 .77 Diluted ......... CONSOLIDATED OPERATING RESULTS (184) (1,163) Operating results 2019 2018 2017 Increased Increase/ Dollars and shares in millions, except per share data Amount (decrease) Amount Idecrease) Amount Revenues Sales by Company-operated restaurants $ 9,421 $10,013 (21%) $12,719 Revenues from franchised restaurants 11,656 11,012 10,101 Total revenues 21,077 21,025 22,820 Operating costs and expenses Company-operated restaurant expenses 7,761 8.266 10,410 Franchised restaurants-occupancy expenses 2,201 1,973 1,789 Selling, general & administrative expenses 2,229 2,200 2,231 Other operating (income) expense, net (237) Total operating costs and expenses 12,007 12,202 13,267 Operating income 9,070 8,823 9,553 Interest expense 1,122 922 Nonoperating (income) expense, net 26 Income before provision for income taxes 8,018 7,816 8,573 Provision for income taxes 1,993 1,892 (44) 3.381 Net income 6,025 $ 5,924 14% $ 5,192 Earnings per common share-diluted 7.88 $ 7.54 18% $ 6.37 Weighted average common shares outstanding- diluted 764.9 785.6 (4%) 815.5 n/m Not meaningful IMPACT OF FOREIGN CURRENCY TRANSLATION ON REPORTED RESULTS While changes in foreign currency exchange rates affect reported results, McDonald's mitigates exposures, where practical, by purchasing goods and services in local currencies, financing in local currencies and hedging certain foreign-denominated cash flows. In 2019, results reflected the weakening of the Euro and most other major currencies. In 2018, results reflected the stronger Euro and British Pound. In 2017, results reflected the stronger Euro, offset by the weaker British Pound. Impact of foreign currency translation on reported results 981 (70) 58 (3%) Currency translation benefit/(cost) 2018 2017 123 186 2019 (606) (51) (256) Reported amount 2018 2017 $21,025 $22,820 1,747 2,309 9,039 8,312 2,200 2,231 8,823 9,553 5,924 5,192 7.54 6.37 In millions, except per share data Revenues Company-operated margins Franchised margins Selling, general & administrative expenses Operating income Net income Earnings per common share-diluted 57 2019 $21,077 1,660 9,455 2,229 9,070 6,025 7.88 29 (13) (280) (165) (0.21) 0.04 THE WENDY'S COMPANY AND SUBSIDIARIES CONSOLIDATED STATEMENTS OF OPERATIONS (In Thousands Except Per Share Amounts) Year Ended December 29, December 30, December 31, 2019 2018 2017 Revenues: Sales .. Franchise royalty revenue and fees ...... Franchise rental income Advertising funds revenue ......... $ 707,485 428,999 233,065 339,453 1,709,002 $ 651,577 409,043 203,297 326,019 1,589,936 $622,802 410,503 190,103 1,223,408 517,935 16,325 88,015 Costs and expenses: Cost of sales ...... Franchise support and other costs ........ Franchise rental expense ... Advertising funds expense .. General and administrative ....... Depreciation and amortization ........... System optimization (gains) losses, net ......... Reorganization and realignment costs. Impairment of long-lived assets ..... Other operating income, net .......... 597,530 43,686 123,929 338,116 200,206 131,693 (1,283) 16,965 6,999 (11,418) 1,446,423 262,579 (115,971) (8,496) 25,598 7,771 171,481 (34,541) $ 136,940 548,588 25,203 91,104 321,866 217,489 128,879 (463) 9,068 4,697 (6,387) 1,340,044 249,892 (119,618) (11,475) 450,736 5,381 574,916 (114,801) $ 460,115 203,593 125,687 39,076 22,574 4,097 (8,652) 1,008,650 214,758 (118,059) Operating profit ................. Interest expense, net Loss on early extinguishment of debt .... Investment income, net ... Other income, net ... Income before income taxes ............ (Provision for) benefit from income taxes ....... Net income .......................... Net income per share: 2,703 1,617 101,019 93,010 $ 194,029 Basic ... ......... $ .60 58 $ 1.93 1.88 $ 79 .77 Diluted


