Question
What evidence do you observe from analyzing the financial statements that might signal the cash flow problems experienced in mid-Year 14? Can FBN avoid bankruptcy
What evidence do you observe from analyzing the financial statements that might signal the cash flow problems experienced in mid-Year 14?
- Can FBN avoid bankruptcy during Year 15? What changes in the design or implementation of FBN's strategy would you recommend? To compute Altman's Z-score, use the low-bid market price for the year to determine the market value of common shareholders' equity.
Douglas C. Mather, founder, chair, and chief executive of Fly-by-Night International Group (FBN), lived the fast-paced, risk-seeking life that he tried to inject into his company. Flying the company's Lear jets, he logged 28 world speed records. Once he throttled a company plane to the top of Mount Everest in three-and-a-half-minutes.
These activities seemed perfectly appropriate at the time. Mather was a Navy fighter pilot in Vietnam and then flew commercial airlines. In the mid-1970s, he started FBN as a pilot training school. With the defense buildup beginning in the early 1980s, Mather branched out into government contracting. He equipped the company's Lear jets with radar jammers and other sophisticated electronic devices to mimic enemy aircraft. He then contracted his "rent-an-enemy" fleet to the Navy and Air Force for use in fighter pilot training. The Pentagon liked the idea, and FBN's revenues grew to $55 million in the fiscal year ending April 30, Year 14. Its common stock, issued to the public in Year 9 at $8.50 a share, reached a high of $16.50 in mid-Year 13. Mather and FBN received glowing write-ups in Business Week and Fortune.
In mid-Year 14, however, FBN began a rapid descent. Although still growing rapidly, its cash flow was inadequate to service its debt. According to Mather, he was "just dumbfounded. There was never an inkling of a problem with cash."
In the fall of Year 14, the board of directors withdrew the company's financial statements for the year ending April 30, Year 14, stating that there appeared to be material misstatements that needed investigation. In December of Year 14, Mather was asked to step aside as manager and director of the company pending completion of an investigation of certain transactions between Mather and the company. On December 29, Year 14, NASDAQ (over-the-counter stock market) discontinued quoting the company's common shares. In February, Year 15, following its investigation, the board of directors terminated Mather's employment and membership on the board.
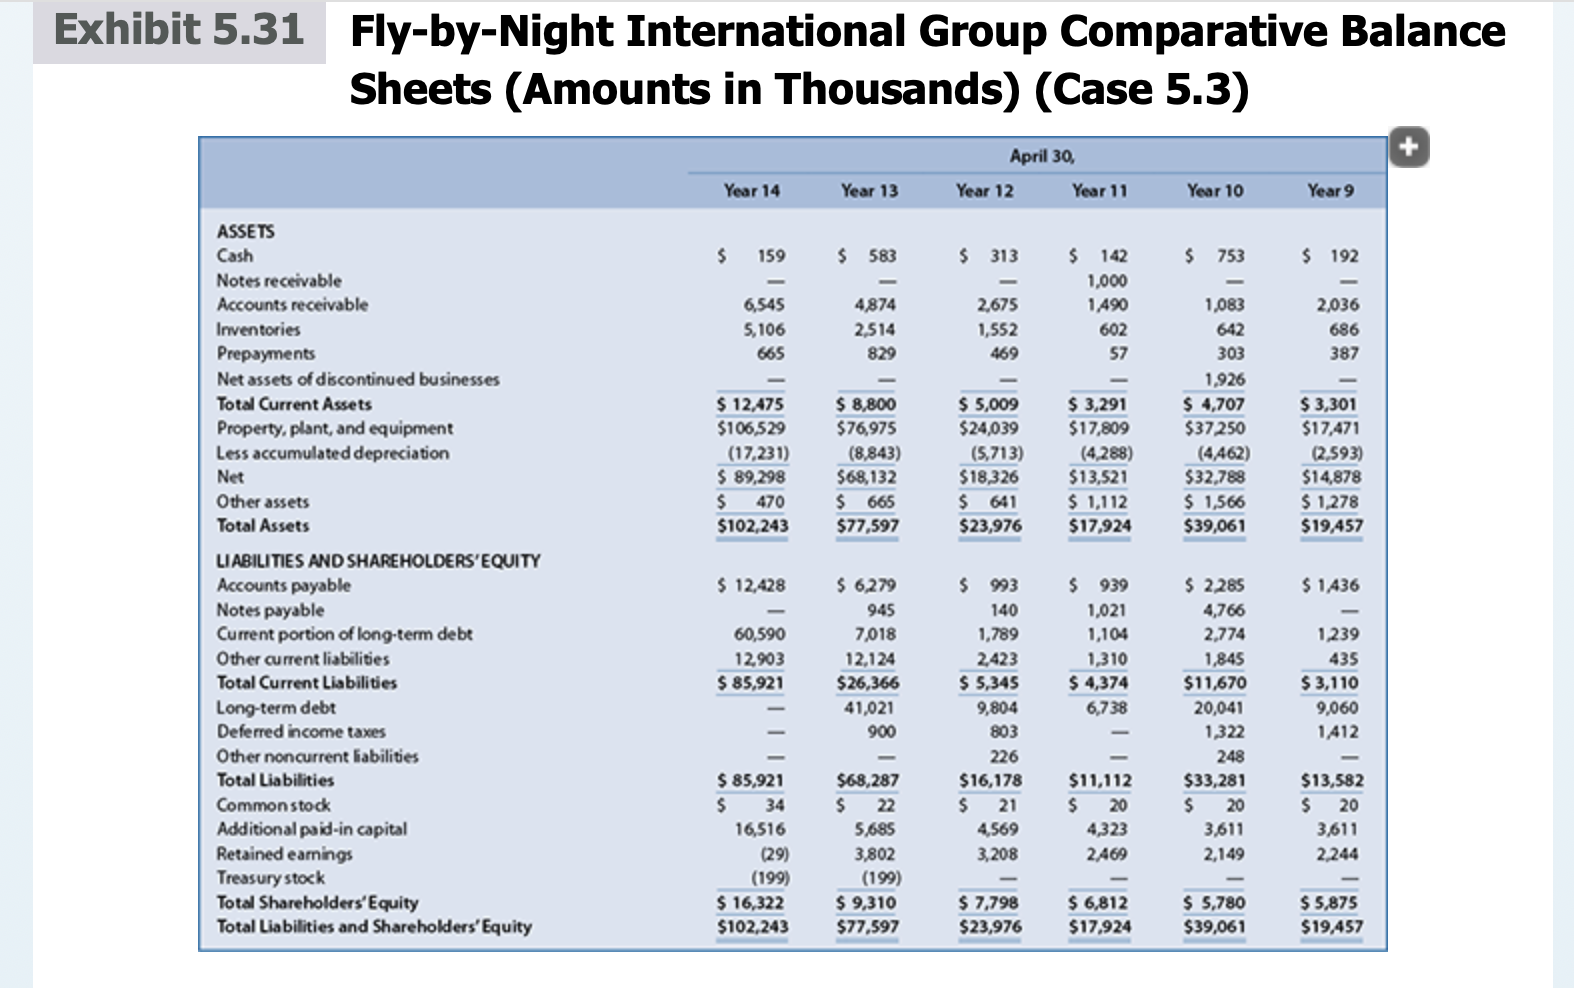
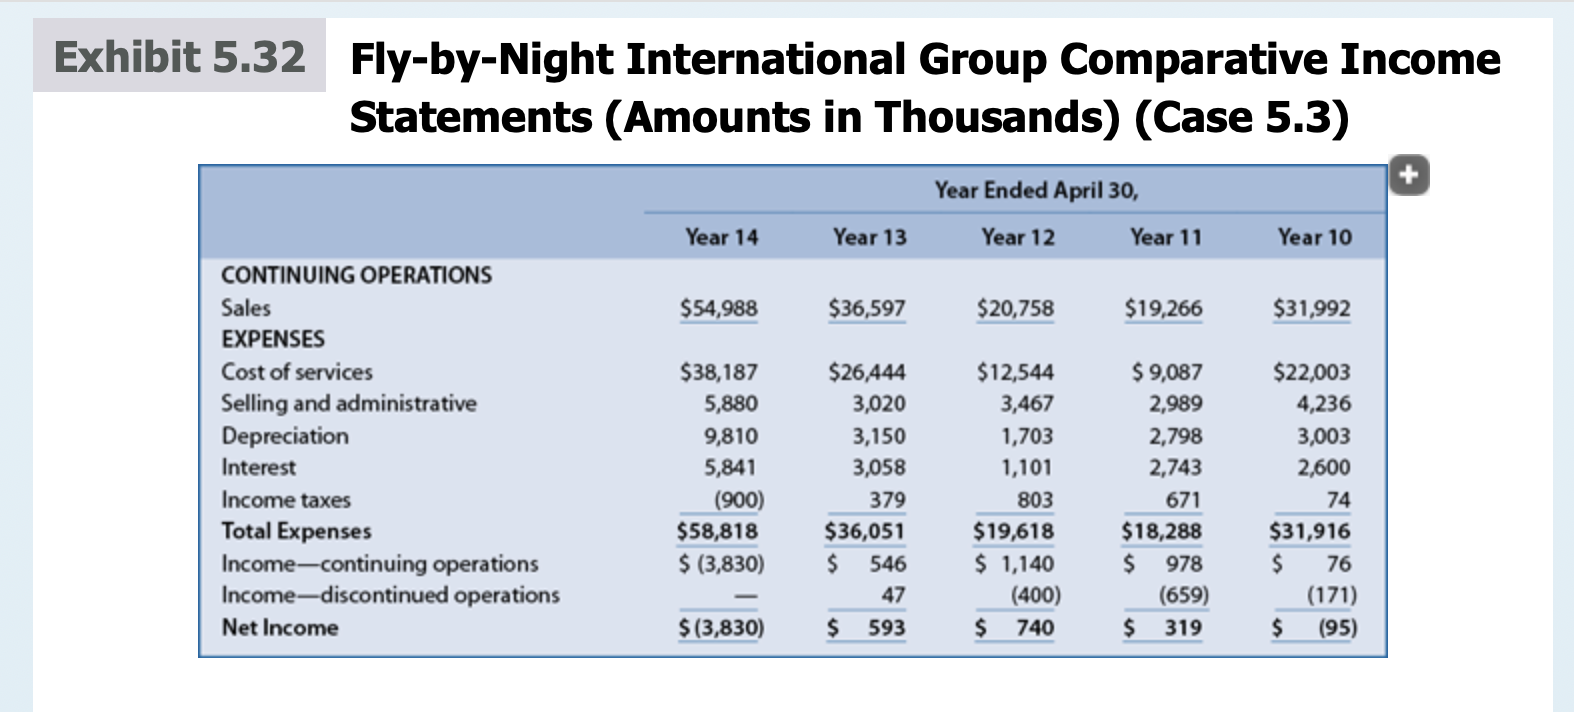
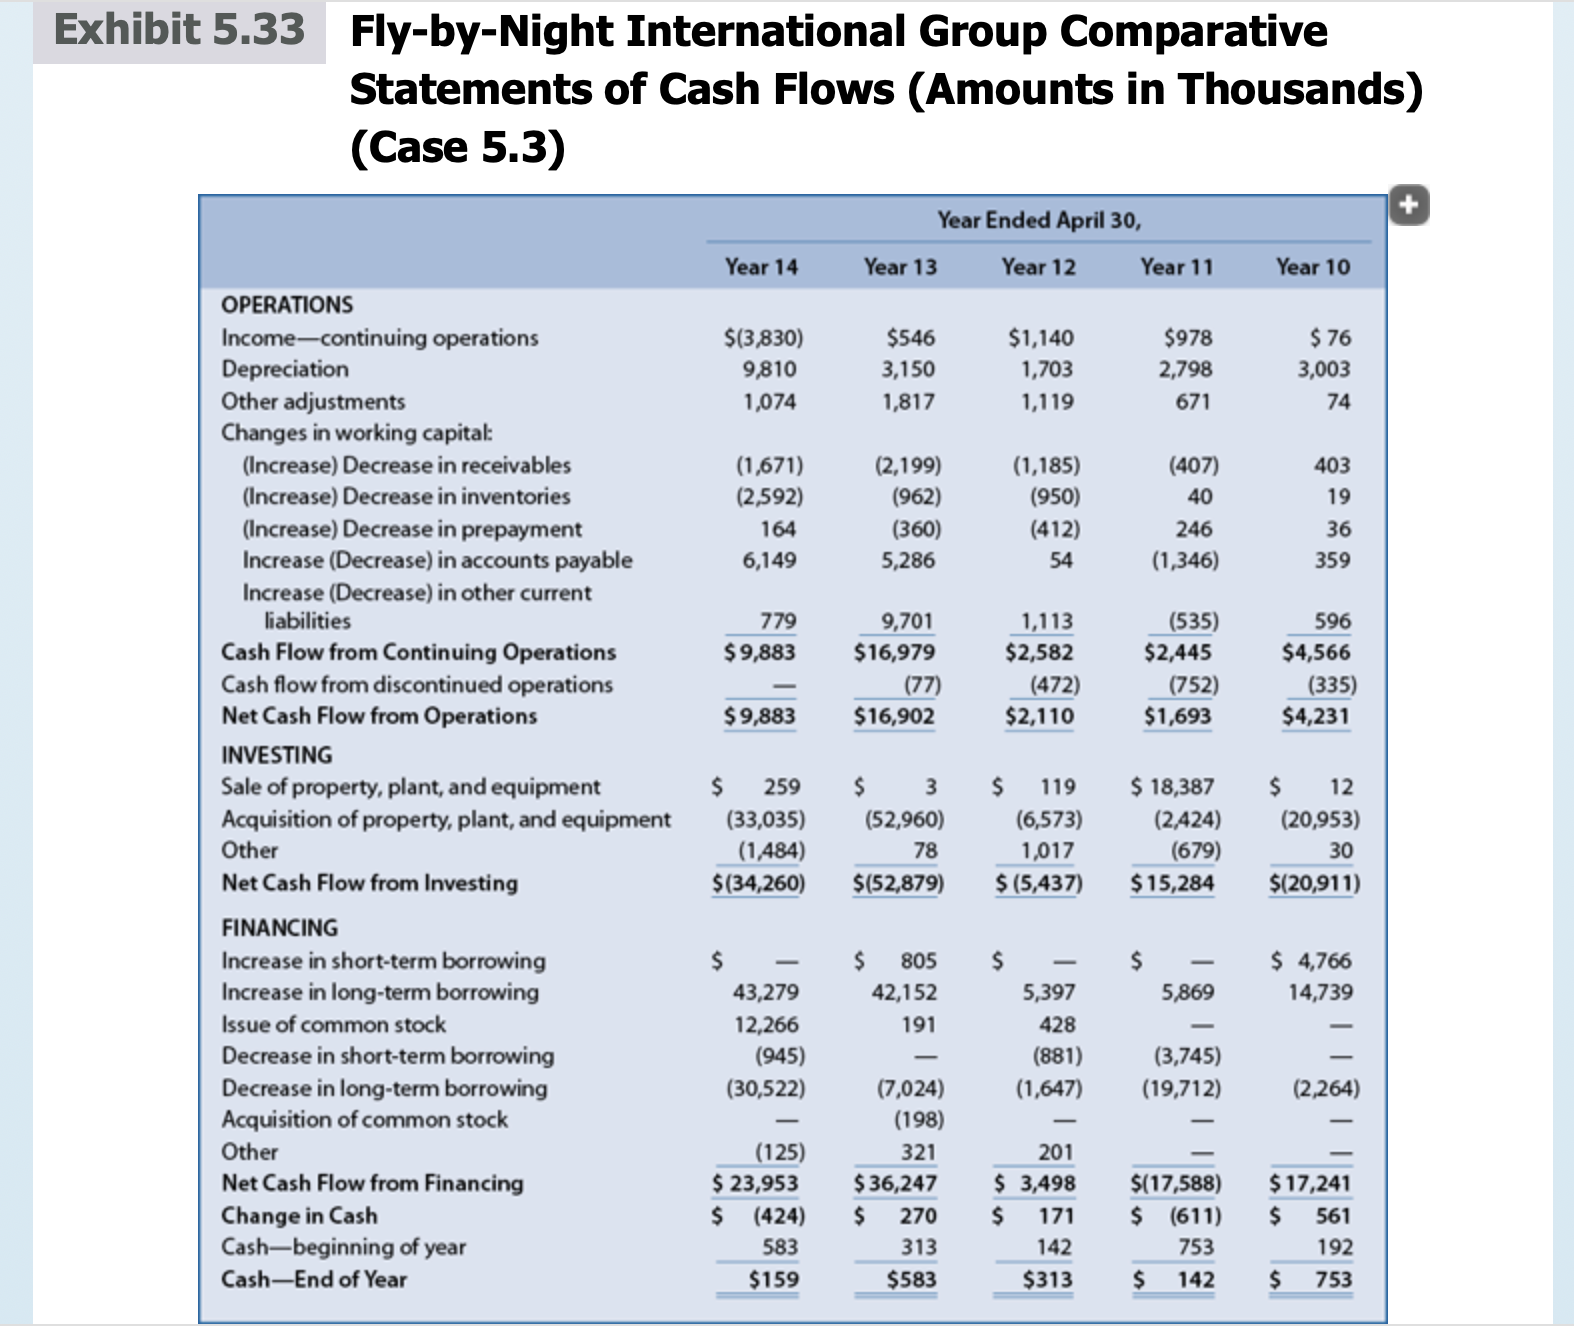
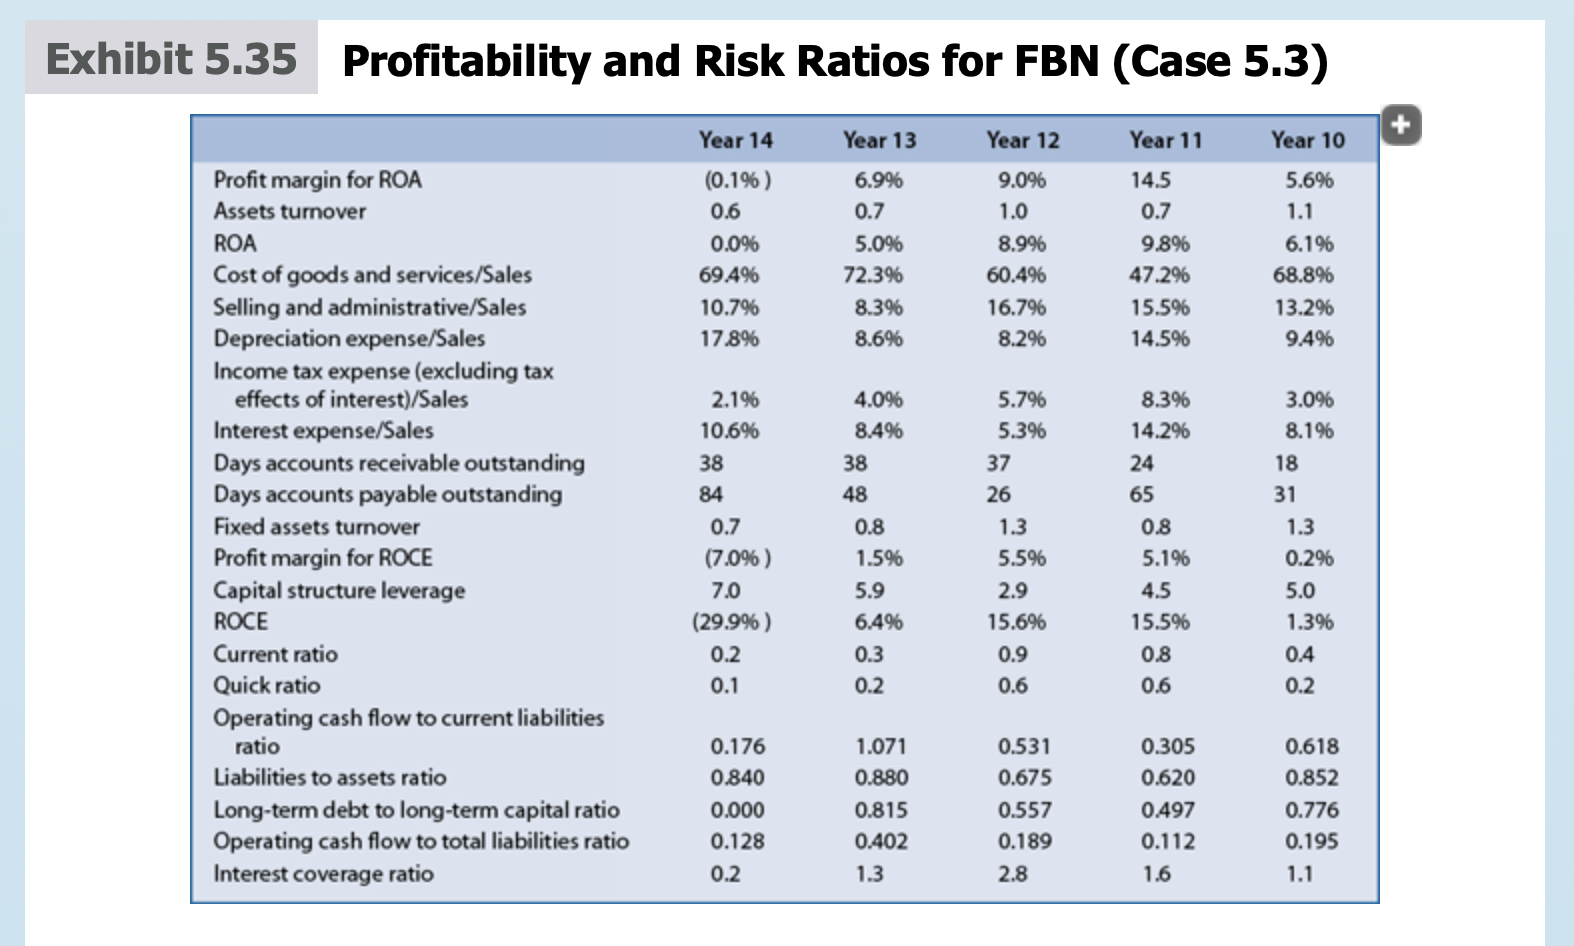
Exhibits 5.31,5.32, and5.33present the financial statements and related notes of FBN for the five years ending April, Year 10, through April, Year 14. The financial statements for Year 10 to Year 12 use the amounts originally reported for each year. The amounts reported on the statement of cash flows for Year 10 (for example, the change in accounts receivable) do not precisely reconcile to the amounts on the balance sheet at the beginning and end of the year because certain items classified as relating to continuing operations on the balance sheet at the end of Year 9 were reclassified as relating to discontinued operations on the balance sheet at the end of Year 10. The financial statements for Year 13 and Year 14 represent the restated financial statements for those years after the board of directors completed its investigation of suspected material misstatements that caused it to withdraw the originally issued financial statements for fiscal Year 14.Exhibit 5.34lists the members of the board of directors. Exhibit 5.35presents profitability and risk ratios for FBN.


Exhibit 5.31 Fly-by-Night International Group Comparative Balance Sheets (Amounts in Thousands) (Case 5.3) April 30, Year 14 Year 13 Year 12 Year 11 Year 10 Year 9 ASSETS Cash $ 159 $ 583 $ 313 $ 142 $ 753 $ 192 Notes receivable Accounts receivable Inventories - 1,000 6,545 4,874 2,675 1,490 1,083 2,036 5,106 2,514 1,552 602 642 686 Prepayments 665 829 469 57 303 387 Net assets of discontinued businesses Total Current Assets Property, plant, and equipment $ 12,475 $106,529 1,926 $ 8,800 $ 5,009 $ 3,291 $ 4,707 $3,301 $76,975 Less accumulated depreciation (17,231) Net $ 89,298 (8,843) $68,132 $24,039 (5,713) $18,326 $17,809 $37,250 $17,471 (4,288) (4,462) (2,593) $13,521 $32,788 $14,878 Other assets $ 470 Total Assets $102,243 $ 665 $77,597 $ 641 $ 1,112 $ 1,566 $1,278 $23,976 $17,924 $39,061 $19,457 LIABILITIES AND SHAREHOLDERS' EQUITY Accounts payable $ 12,428 Notes payable $ 6,279 945 $ 993 $ 939 $ 2,285 $1,436 140 1,021 4,766 Current portion of long-term debt Other current liabilities Total Current Liabilities Long-term debt Deferred income taxes Other noncurrent liabilities Total Liabilities Common stock Additional paid-in capital Retained earnings Treasury stock Total Shareholders' Equity Total Liabilities and Shareholders' Equity 60,590 12,903 $ 85,921 7,018 1,789 1,104 2,774 1,239 12,124 $26,366 41,021 900 2,423 1,310 1,845 435 $5,345 $ 4,374 $11,670 $3,110 9,804 6,738 803 20,041 1,322 9,060 1,412 226 248 $ 85,921 $68,287 $16,178 $11,112 $33,281 $13,582 $ 34 $ 22 $ 21 $ 20 $ 20 $ 20 16,516 5,685 4,569 4,323 3,611 (29) 3,802 3,208 2,469 2,149 3,611 2,244 (199) (199) $ 16,322 $ 9,310 $ 7,798 $ 6,812 $ 5,780 $ 5,875 $102,243 $77,597 $23,976 $17,924 $39,061 $19,457
Step by Step Solution
There are 3 Steps involved in it
Step: 1

Get Instant Access to Expert-Tailored Solutions
See step-by-step solutions with expert insights and AI powered tools for academic success
Step: 2

Step: 3

Ace Your Homework with AI
Get the answers you need in no time with our AI-driven, step-by-step assistance
Get Started


