Answered step by step
Verified Expert Solution
Question
1 Approved Answer
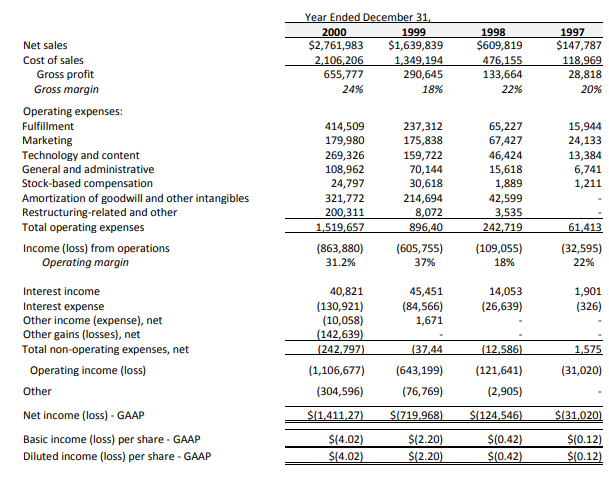
Whats the largest driver in the company's losses? Year Ended December 31 2000 1999 $2,761,983 $1,639,839 2.106,206 1.349,194 655,777 290,645 24% 18% 1998 $609,819 476,155

Whats the largest driver in the company's losses?
Year Ended December 31 2000 1999 $2,761,983 $1,639,839 2.106,206 1.349,194 655,777 290,645 24% 18% 1998 $609,819 476,155 133,664 22% 1997 $147,787 118,969 28,818 20% Net sales Cost of sales Gross profit Gross margin Operating expenses: Fulfillment Marketing Technology and content General and administrative Stock-based compensation Amortization of goodwill and other intangibles Restructuring-related and other Total operating expenses Income (loss) from operations Operating margin 15,944 24,133 13,384 6,741 1,211 414,509 179,980 269,326 108,962 24,797 321,772 200,311 1,519,657 (863,880) 31.2% 237,312 175,838 159,722 70,144 30,618 214,694 8,072 896.40 (605,755) 37% 65,227 67,427 46,424 15,618 1,889 42,599 3,535 242,719 (109,055) 18% 61,413 (32,595) 22% 45,451 (84,566) 1,671 14,053 (26,639) 1,901 (326) 40,821 (130,921) (10,058) (142,639) (242,797) (1,106,677) (304,596) $(1,411,27) (37,44 Interest income Interest expense Other income (expense), net Other gains (losses), net Total non-operating expenses, net Operating income (loss) Other Net income (loss) - GAAP Basic income (loss) per share - GAAP Diluted income (loss) per share - GAAP 1.575 (12.586) (121,641) (2,905) (643,199) (76,769) (31,020) $1719.968) $(124,546) $131,020) $(4.02) $14.02) $(2.20) $12.20 $(0.42) $(0.42) $(0.12) $10.12)Step by Step Solution
There are 3 Steps involved in it
Step: 1

Get Instant Access to Expert-Tailored Solutions
See step-by-step solutions with expert insights and AI powered tools for academic success
Step: 2

Step: 3

Ace Your Homework with AI
Get the answers you need in no time with our AI-driven, step-by-step assistance
Get Started


