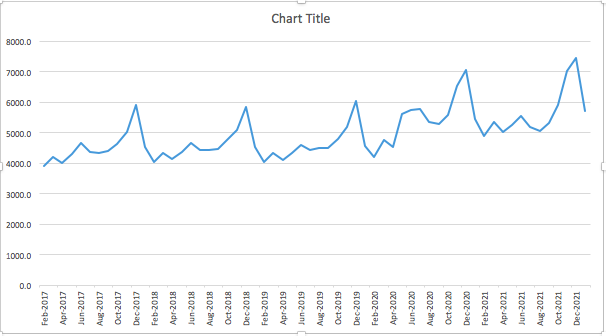
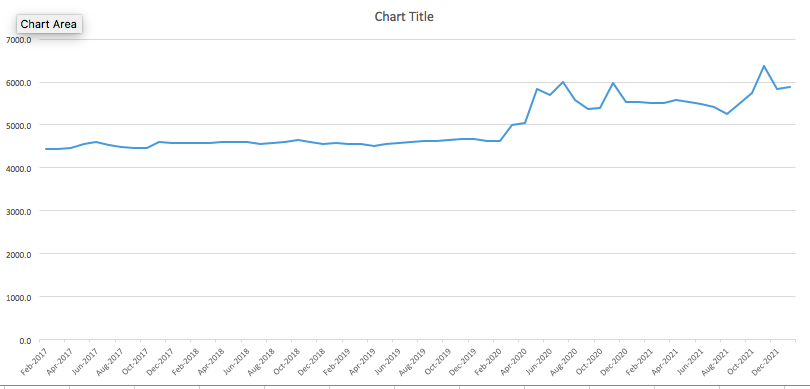
which forecasting methods are most suitable (out of holts exponential smoothing method, simple exponential smoothing and holts winter exponential smoothing) for the graphs seen below?
which forecasting methods are most suitable (out of holts exponential smoothing method, simple exponential smoothing and holts winter exponential smoothing) for the graphs seen below?
graph 1


Feb-2017 Apr-2017 Jun-2017 Aug-2017 Oct-2017 Dec-2017 Feb-2018 Apr-2018 Jun-2018 Aug-2018 Oct-2018 Dec-2018 Feb-2019 Apr-2019 Jun-2019 Aug-2019 Oct-2019 Dec-2019 Feb-2020 Apr-2020 Jun-2020 Aug-2020 Oct-2020 Dec-2020 Feb-2021 Apr-2021 Jun-2021 Aug-2021 Oct-2021 Dec-2021 0.0 1000.0 2000.0 3000.0 4000.0 5000.0 6000.0 7000.0 8000.0 Chart Title
Step by Step Solution
3.35 Rating (158 Votes )
There are 3 Steps involved in it
Step: 1
Examining the graph and deciding which forecasting approaches are most appropriate based on the obse...
See step-by-step solutions with expert insights and AI powered tools for academic success
Step: 2

Step: 3

Ace Your Homework with AI
Get the answers you need in no time with our AI-driven, step-by-step assistance
Get Started


