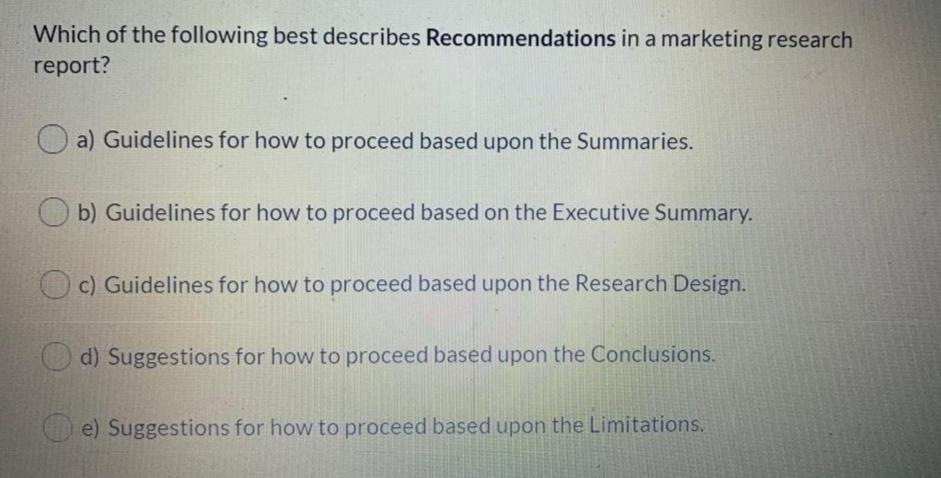
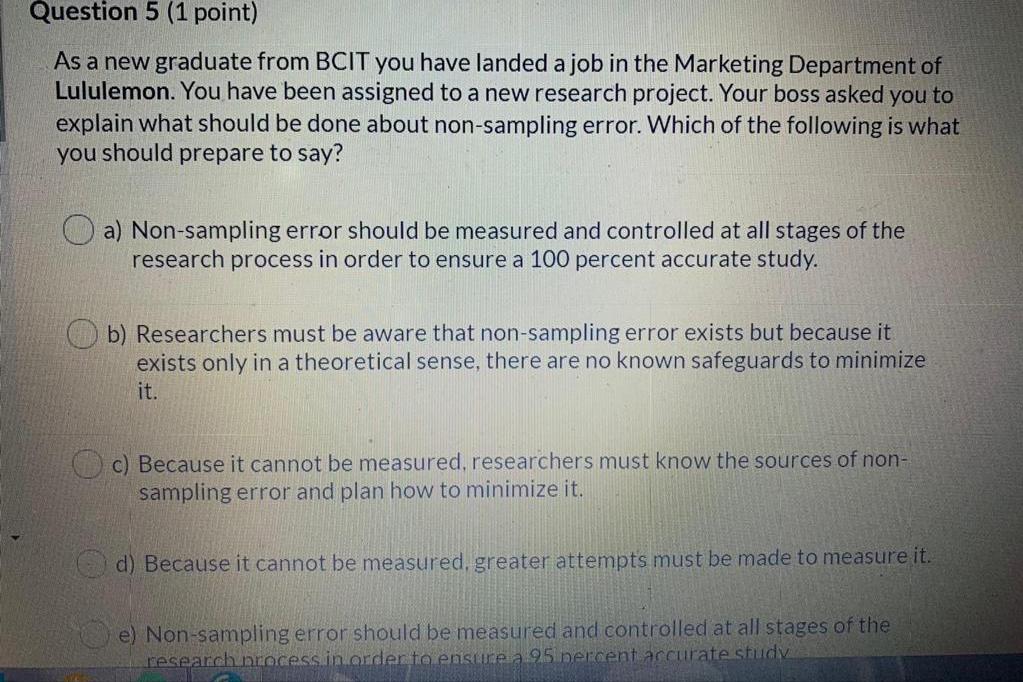
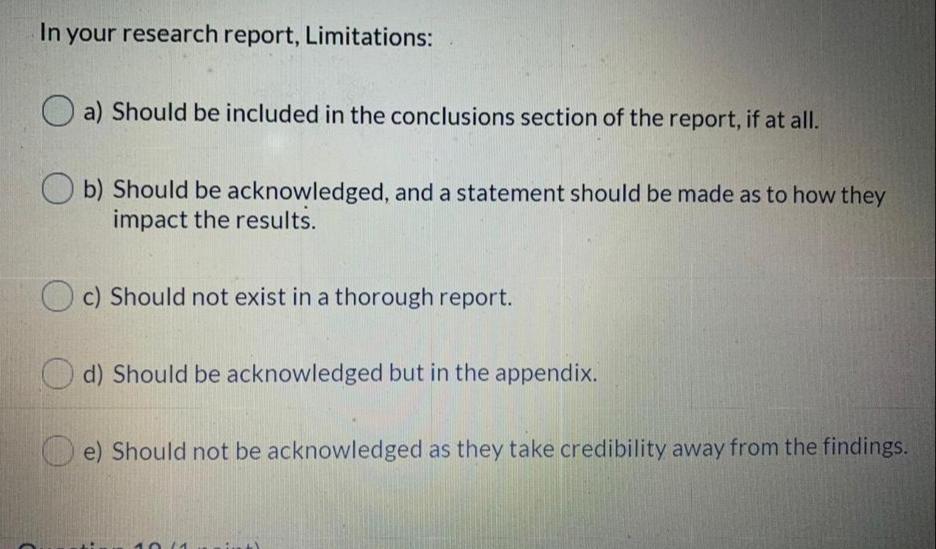
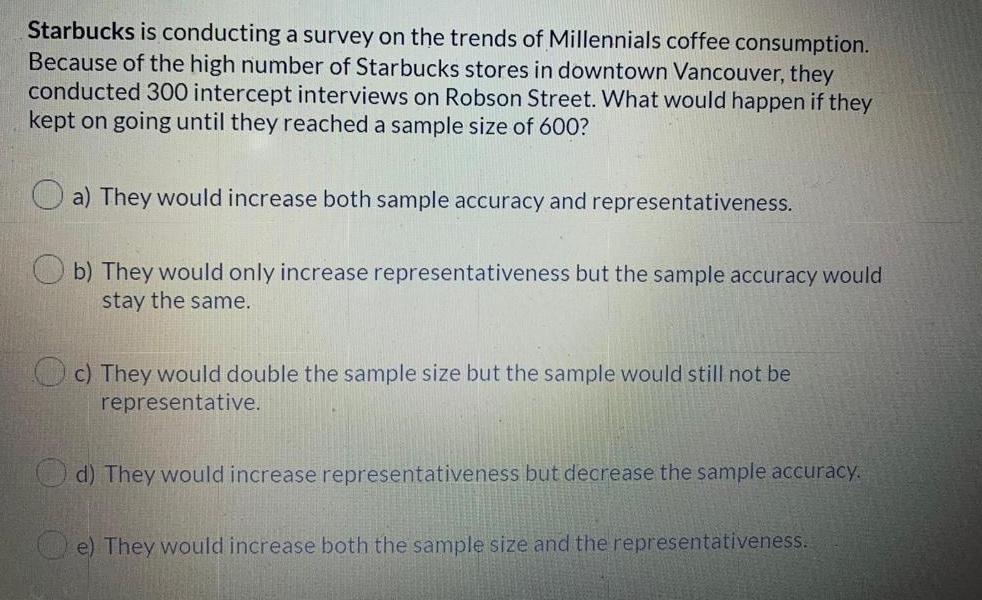
Which of the following best describes Recommendations in a marketing research report? (a) Guidelines for how to proceed based upon the Summaries. b) Guidelines for how to proceed based on the Executive Summary. c) Guidelines for how to proceed based upon the Research Design. d) Suggestions for how to proceed based upon the Conclusions. e) Suggestions for how to proceed based upon the Limitations.Question 5 (1 point) As a new graduate from BCIT you have landed a job in the Marketing Department of Lululemon. You have been assigned to a new research project. Your boss asked you to explain what should be done about non-sampling error. Which of the following is what you should prepare to say? a) Non-sampling error should be measured and controlled at all stages of the research process in order to ensure a 100 percent accurate study. (b) Researchers must be aware that non-sampling error exists but because it exists only in a theoretical sense, there are no known safeguards to minimize it. c) Because it cannot be measured, researchers must know the sources of non- sampling error and plan how to minimize it. d) Because it cannot be measured, greater attempts must be made to measure it. e) Non-sampling error should be measured and controlled at all stages of the research process in order to ensure a 95 percent accurate shudviaIn your research report, Limitations: (a) Should be included in the conclusions section of the report, if at all. Ob) Should be acknowledged, and a statement should be made as to how they impact the results. O c) Should not exist in a thorough report. Od) Should be acknowledged but in the appendix. e) Should not be acknowledged as they take credibility away from the findings.Starbucks is conducting a survey on the trends of Millennials coffee consumption. Because of the high number of Starbucks stores in downtown Vancouver, they conducted 300 intercept interviews on Robson Street. What would happen if they kept on going until they reached a sample size of 600? Oa) They would increase both sample accuracy and representativeness. b) They would only increase representativeness but the sample accuracy would stay the same. c) They would double the sample size but the sample would still not be representative. d) They would increase representativeness but decrease the sample accuracy. (e) They would increase both the sample size and the representativenessWhich of the following is true regarding a probability sample? a) The larger the sample size, the more sample error, because there are more people. O b) They only become accurate when they are larger than 1,000. c) The larger the sample size, the more inaccurate it is. O d) The sample size has no effect on accuracy. ()e) The larger the sample size, the more accurate it is (less sample error).The food court in Pacific Center is planning to use an intercept sample, which is a non- probability sample, to collect data from the customers. Which of the following statements would be applicable to determining sample size? a) Estimate a population value within a stated percent of allowable error. Ob) Use the sample size formula for estimating a mean. c) They cannot calculate the sample size as the formula is only applicable when probability sampling is used. d) Use confidence intervals. (e) Use the sample size formula for estimating a percentage.According to how you were taught to construct a crosstab table, the goes in the columns and the goes in the rows. Use the answers below to fill in the blanks in this statement: Oa) Chi-square, Crosstab. Ob) Crosstab, Chi-Square. Oc) Vertical variable, Horizontal variable. d) Dependent variable, Independent variable. (e) Independent variable, Dependent variable.The Bay is conducting an online survey on their Customer Service web page. They are using banners and pop-ups to recruit website visitors for their survey. Which sample method is The Bay using? a) Quota sampling. Ob) Customer sampling. Oc) Service sampling. d) River sampling. Oe) Invitation sampling.The researcher for an Amazon customer survey was reviewing the frequency distribution of several variables. Which is the best description of a frequency distribution? (a) When the dependent and the independent variables are significant. (b) The number of frequencies that normal distributions appear in a dataset. (c) The number of times a specific respondent answers each survey question. d) The number of times that each answer. (value) appears in a particular question. e) Depicting the accumulative variance in a dataset.Researchers can misuse the concept of significance, if they associate statistical significance with the strength of the trend. Choose the BEST explanation: (a) True because the strength is the flip-side of significance, such as a significance of 0.05 gives the strength of 0.95. b) False because XLDA provides the significance, so you can't misuse it. c) False because the larger the significance the stronger the trend. (d) True because researchers are often pressured for time, and interpreting the significance as strength is a time-saving rule-of-thumb. e) True because significance only indicates that there is an association, but not the strength of the trend.The researcher for the Kitsilano Burger Bar customer survey was analyzing crosstabs to profile the segments in terms of Age and Satisfaction. He was examining the XLDA output and looking at the level of significance. A sig. value of 0.05 means: a) That there is a significant relationship between the two variables and this information alone is adequate to explain the nature of the association. (b) That there is no association between Age and Satisfaction. c) That the relationship between Age and Satisfaction is due to chance. (@d) That there is only a 5 percent chance that the two variables are related. ()e) That there is a significant relationship between the two variables, but this information alone is just a signal that we need to look more closely at the variables to analyze for trends in the table.Before starting the data analysis Jim has to determine the level of measurement of the variables. What should Jim conclude about the level of measurement of the above questions? Oa) Q2 & Q3 are non-metric, but there is not enough information to determine the level for Q1 because it is an open-ended question. (b) Q1 is a metric variable, and Q2 & Q3 are non-metric variables. c) All of the questions non-metric variables. Od) Q1 is a non-metric and Q2 & Q3 are metric variables. e) All of the questions are metric variables