

Question
write a program that analyzes the percentage of the population development between the years 1960 and 2021 for the countries in the DataFrame df_ worldpubind
write a program that analyzes the percentage of the population development between the years 1960 and 2021 for the countries in the DataFrame df_ worldpubind by performing the following tasks: Task a: Create a table (on the screen) containing the percentage population growth for the 5 countries with the most negative population change (i.e. population decline) and the 5 countries with the largest positive population change (ie population increase) between 1960 and 2021. Also display the same information graphically in two bar charts where the first the bar chart shows the five countries with the negative population growth and that the second bar graph shows the countries with positive population growth. On The x-axis shows the countries and on and the y-axis the percentage population development. We define the percentage population development from the year 1960 to the year 2021 according to the formula: ((number_of_inhabitants_2021 number_of_inhabitants_1960) / number_of_inhabitants_1960)*100 Task b: Create a program that first asks for a country and then calculates and presents it the percentage change in population year by year during the time period 1961 2021 in a line graph. The percentage population change between year (x-1) and year x where x is one years between 1961 and 2021 are calculated according to the formula: ((number_of_residents_year_x number_of_residents_year_x-1) / number_of_residents_year_x-1) *100. The result of the calculations should be put in a new column named population_change. The x-axis of the line graph contains the years and the left y-axis indicates the percentage population change. As a final part in this task, add a right y-axis i the diagram and plot a line graph of the number of inhabitants per year.
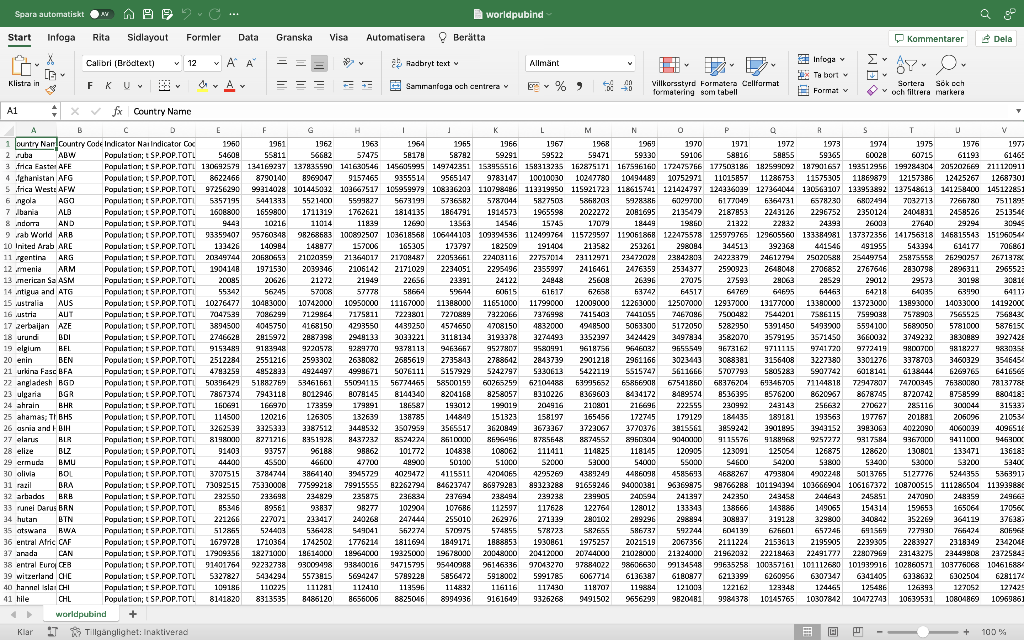
Here is a picture of the csv file wich continues till year 2021
Step by Step Solution
There are 3 Steps involved in it
Step: 1

Get Instant Access to Expert-Tailored Solutions
See step-by-step solutions with expert insights and AI powered tools for academic success
Step: 2

Step: 3
Ace Your Homework with AI
Get the answers you need in no time with our AI-driven, step-by-step assistance
Get Started
Advanced MySQL 8 Discover The Full Potential Of MySQL And Ensure High Performance Of Your Database
Authors: Eric Vanier ,Birju Shah ,Tejaswi Malepati
1st Edition
1788834445, 978-1788834445