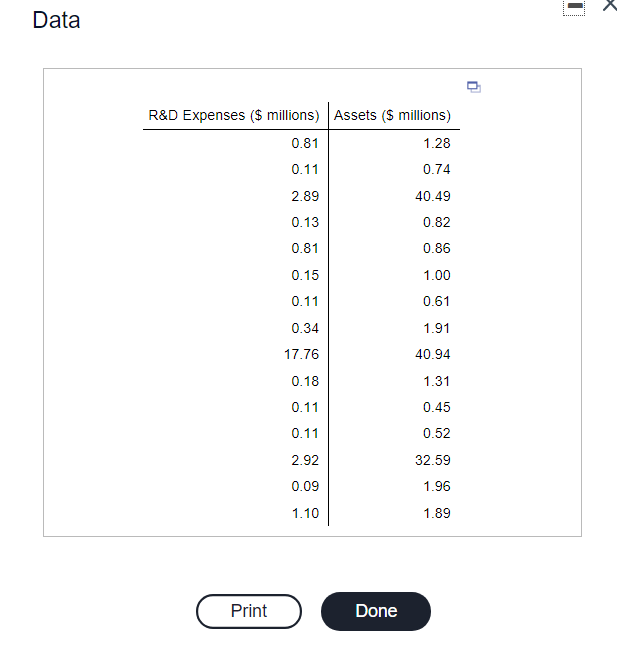
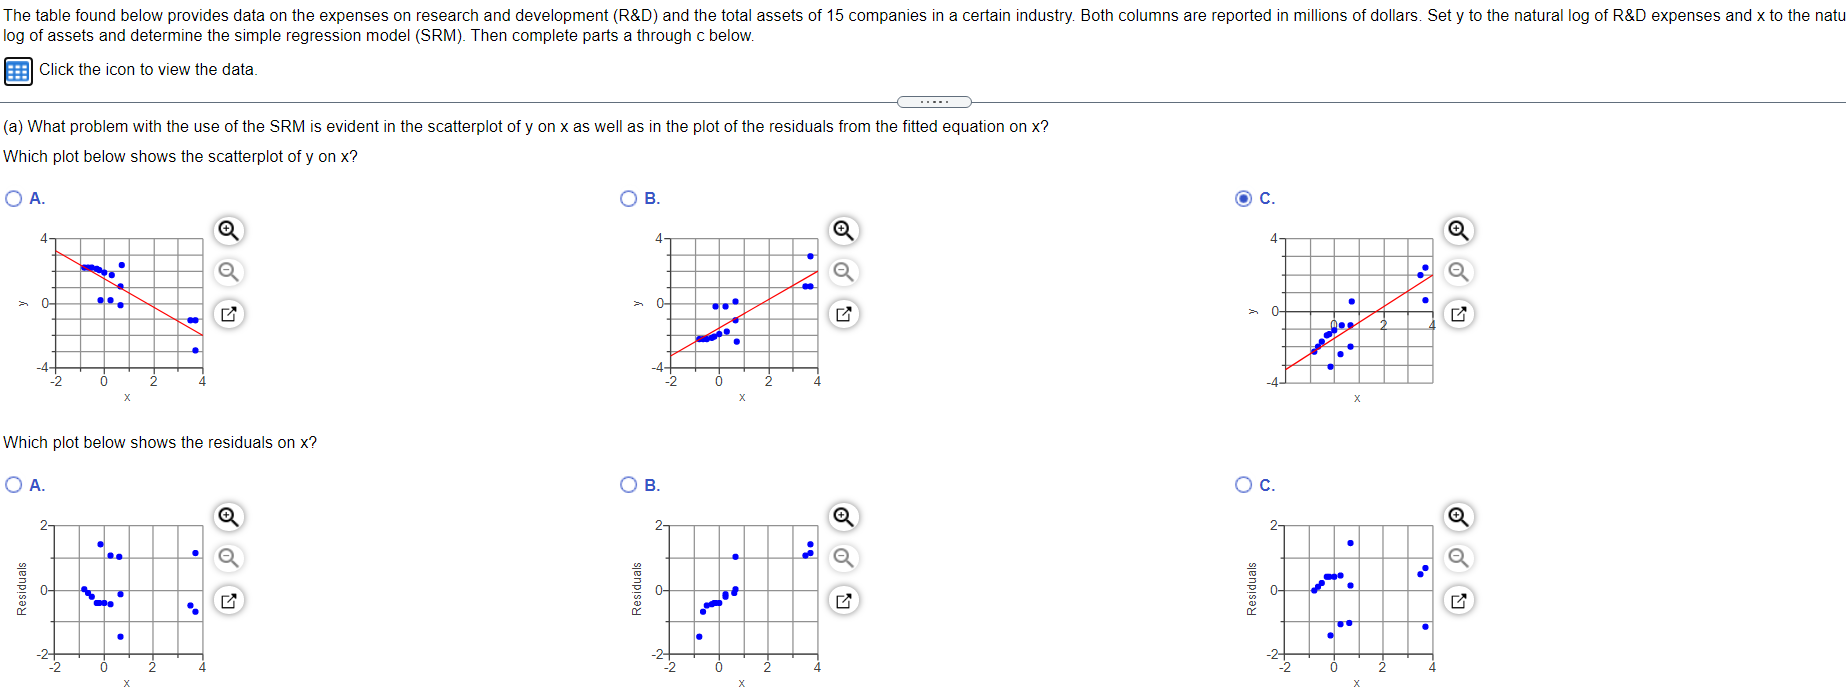
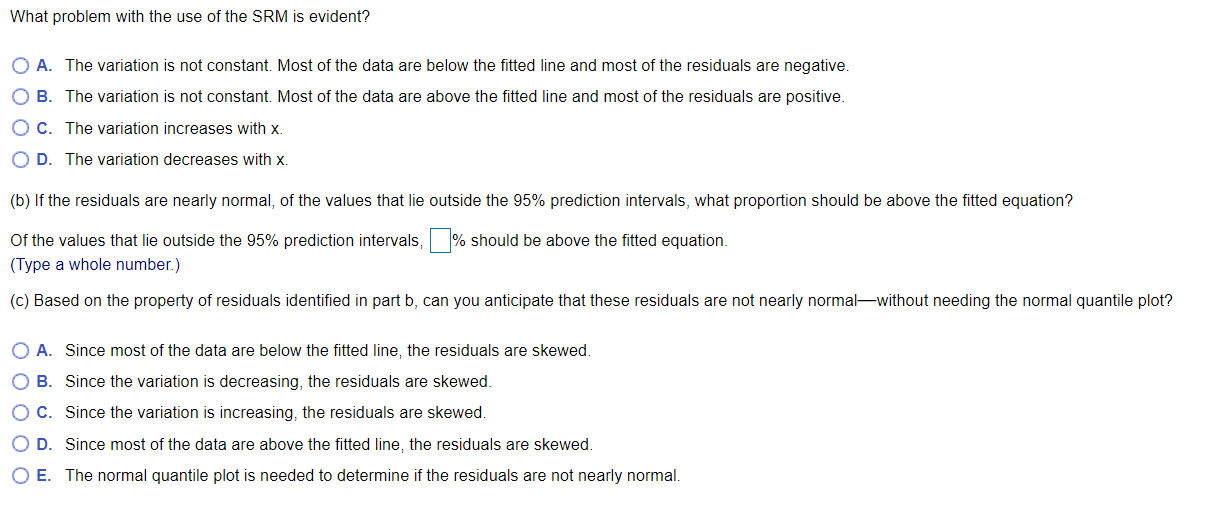
X 1 Data 0 R&D Expenses ($ millions) Assets ($ millions) 0.81 1.28 0.11 0.74 2.89 40.49 0.13 0.82 0.81 0.86 0.15 1.00 0.11 0.61 0.34 1.91 17.76 40.94 0.18 1.31 0.11 0.45 0.11 0.52 2.92 32.59 0.09 1.96 1.10 1.89 Print Done The table found below provides data on the expenses on research and development (R&D) and the total assets of 15 companies in a certain industry. Both columns are reported in millions of dollars. Set y to the natural log of R&D expenses and x to the natu log of assets and determine the simple regression model (SRM). Then complete parts a through c below. Click the icon to view the data (a) What problem with the use of the SRM is evident in the scatterplot of y on x as well as in the plot of the residuals from the fitted equation on x? Which plot below shows the scatterplot of y on x? OA B. C. 4 4 4- * 0- do 0 . 06 . -4- -2 -2 0 2 -4- X Which plot below shows the residuals on x? OA. . Oc. 2- 2- . . Residuals 9 Residuals Residuals 0- . . 0 2 4 0 2 -2 0 2 4 X What problem with the use of the SRM is evident? O A. The variation is not constant. Most of the data are below the fitted line and most of the residuals are negative. B. The variation is not constant. Most of the data are above the fitted line and most of the residuals are positive. O C. The variation increases with x. OD. The variation decreases with x. (b) If the residuals are nearly normal, of the values that lie outside the 95% prediction intervals, what proportion should be above the fitted equation? Of the values that lie outside the 95% prediction intervals, N% should be above the fitted equation. (Type a whole number.) (c) Based on the property of residuals identified in part b, can you anticipate that these residuals are not nearly normalwithout needing the normal quantile plot? O A. Since most of the data are below the fitted line, the residuals are skewed. OB. Since the variation is decreasing, the residuals are skewed. O C. Since the variation is increasing, the residuals are skewed. OD. Since most of the data are above the fitted line, the residuals are skewed. O E. The normal quantile plot is needed to determine if the residuals are not nearly normal. X 1 Data 0 R&D Expenses ($ millions) Assets ($ millions) 0.81 1.28 0.11 0.74 2.89 40.49 0.13 0.82 0.81 0.86 0.15 1.00 0.11 0.61 0.34 1.91 17.76 40.94 0.18 1.31 0.11 0.45 0.11 0.52 2.92 32.59 0.09 1.96 1.10 1.89 Print Done The table found below provides data on the expenses on research and development (R&D) and the total assets of 15 companies in a certain industry. Both columns are reported in millions of dollars. Set y to the natural log of R&D expenses and x to the natu log of assets and determine the simple regression model (SRM). Then complete parts a through c below. Click the icon to view the data (a) What problem with the use of the SRM is evident in the scatterplot of y on x as well as in the plot of the residuals from the fitted equation on x? Which plot below shows the scatterplot of y on x? OA B. C. 4 4 4- * 0- do 0 . 06 . -4- -2 -2 0 2 -4- X Which plot below shows the residuals on x? OA. . Oc. 2- 2- . . Residuals 9 Residuals Residuals 0- . . 0 2 4 0 2 -2 0 2 4 X What problem with the use of the SRM is evident? O A. The variation is not constant. Most of the data are below the fitted line and most of the residuals are negative. B. The variation is not constant. Most of the data are above the fitted line and most of the residuals are positive. O C. The variation increases with x. OD. The variation decreases with x. (b) If the residuals are nearly normal, of the values that lie outside the 95% prediction intervals, what proportion should be above the fitted equation? Of the values that lie outside the 95% prediction intervals, N% should be above the fitted equation. (Type a whole number.) (c) Based on the property of residuals identified in part b, can you anticipate that these residuals are not nearly normalwithout needing the normal quantile plot? O A. Since most of the data are below the fitted line, the residuals are skewed. OB. Since the variation is decreasing, the residuals are skewed. O C. Since the variation is increasing, the residuals are skewed. OD. Since most of the data are above the fitted line, the residuals are skewed. O E. The normal quantile plot is needed to determine if the residuals are not nearly normal