Question
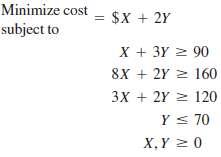
Consider this LP formulation: Graphically illustrate the feasible region and apply the isocost line procedure to indicate which corner point produces the optimal solution. What
Consider this LP formulation:

Graphically illustrate the feasible region and apply the isocost line procedure to indicate which corner point produces the optimal solution. What is the cost of this solution?
Minimize cost = $X + 2Y %3D subject to + 3Y 90 8X + 2Y 2 160 3X + 2Y 2 120 Y s 70 X,Y 2 0
Step by Step Solution
3.39 Rating (155 Votes )
There are 3 Steps involved in it
Step: 1
X2571...
Get Instant Access to Expert-Tailored Solutions
See step-by-step solutions with expert insights and AI powered tools for academic success
Step: 2

Step: 3

Ace Your Homework with AI
Get the answers you need in no time with our AI-driven, step-by-step assistance
Get StartedRecommended Textbook for
Managerial Economics Markets and the Firm
Authors: William Boyes
2nd edition
618988629, 978-0618988624
Students also viewed these Algorithms questions
Question
Answered: 1 week ago
Question
Answered: 1 week ago
Question
Answered: 1 week ago
Question
Answered: 1 week ago
Question
Answered: 1 week ago
Question
Answered: 1 week ago
Question
Answered: 1 week ago
Question
Answered: 1 week ago
Question
Answered: 1 week ago
Question
Answered: 1 week ago
Question
Answered: 1 week ago
Question
Answered: 1 week ago
Question
Answered: 1 week ago
Question
Answered: 1 week ago
Question
Answered: 1 week ago
Question
Answered: 1 week ago
Question
Answered: 1 week ago
Question
Answered: 1 week ago
Question
Answered: 1 week ago
Question
Answered: 1 week ago
Question
Answered: 1 week ago
View Answer in SolutionInn App


