Answered step by step
Verified Expert Solution
Question
1 Approved Answer
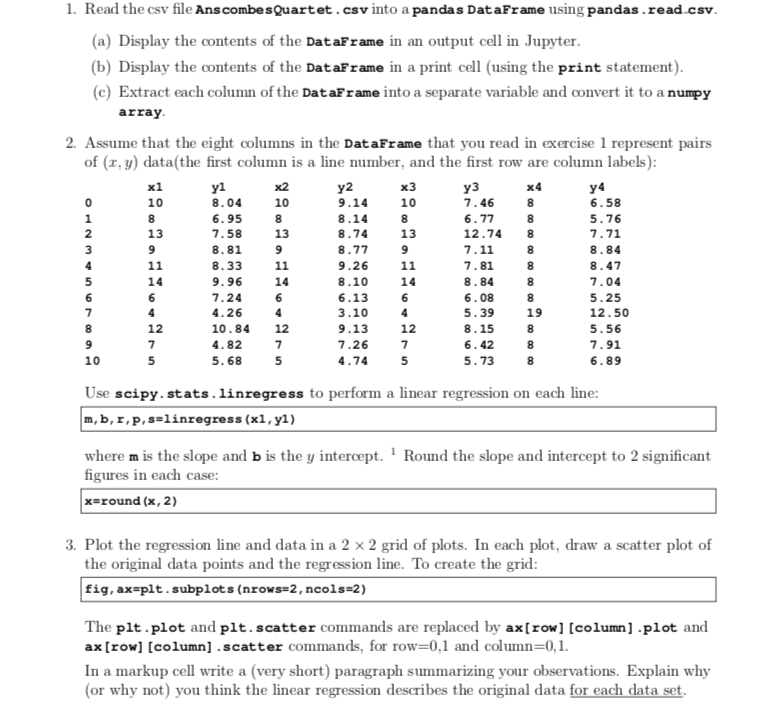
x1,y1,x2,y2,x3,y3,x4,y4 10,8.04,10,9.14,10,7.46,8,6.58 8,6.95,8,8.14,8,6.77,8,5.76 13,7.58,13,8.74,13,12.74,8,7.71 9,8.81,9,8.77,9,7.11,8,8.84 11,8.33,11,9.26,11,7.81,8,8.47 14,9.96,14,8.1,14,8.84,8,7.04 6,7.24,6,6.13,6,6.08,8,5.25 4,4.26,4,3.1,4,5.39,19,12.5 12,10.84,12,9.13,12,8.15,8,5.56 7,4.82,7,7.26,7,6.42,8,7.91 5,5.68,5,4.74,5,5.73,8,6.89 1. Read the csv file Ans combesQuartet.csv into a pandas DataFrame using pandas.read

x1,y1,x2,y2,x3,y3,x4,y4
10,8.04,10,9.14,10,7.46,8,6.58
8,6.95,8,8.14,8,6.77,8,5.76
13,7.58,13,8.74,13,12.74,8,7.71
9,8.81,9,8.77,9,7.11,8,8.84
11,8.33,11,9.26,11,7.81,8,8.47
14,9.96,14,8.1,14,8.84,8,7.04
6,7.24,6,6.13,6,6.08,8,5.25
4,4.26,4,3.1,4,5.39,19,12.5
12,10.84,12,9.13,12,8.15,8,5.56
7,4.82,7,7.26,7,6.42,8,7.91
5,5.68,5,4.74,5,5.73,8,6.89
1. Read the csv file Ans combesQuartet.csv into a pandas DataFrame using pandas.read csv (a) Display the contents of the DataFrame in an output cell in Jupyter (b) Display the contents of the DataFrame in a print cell (using the print statement) (c) Extract each column of the DataFrame into a separate variable and convert it to a numpy array 2. Assume that the eight columns in the DataFrame that you read in exercise 1 represent pairs of (, y data(the first column is a line number, and the first row are column labels) 2 9.14 8.14 8.74 8.77 9.26 8.10 6.13 3.10 9.13 7.26 4.74 x1 10 8.04 6.95 7.58 8.81 8.33 9.96 7.24 4.26 10.8412 4.82 5.68 10 7.46 6.77 12.748 7.11 7.81 8.84 6.08 5.39 8.15 6.42 5.73 6.58 5.76 7.71 8.84 8.47 7.04 5.25 12.50 5.56 7.91 6.89 10 2 3 13 13 13 14 14 14 19 12 12 10 Use scipy. stats.linregress to perform a linear regression on each line: m, b,r,P, s linregress (x1,yl) where m is the slope and b is the y intercept.Round the slope and intercept to 2 significant figures in each case: x-round (x, 2) 3. Plot the regression line and data in a 2 x 2 grid of plots. In each plot, draw a scatter plot of the original data points and the regression line. To create the grid fig, ax-plt.subplots (nrows-2, ncols-2) The plt.plot and plt.scatter commands are replaced by ax[row] [column] .plot and ax(row] [column] .scatter commands" for row=0.1 and column=0.1 In a markup cell write a (very short) paragraph summarizing your observations. Explain why or why not) you think the linear regression describes the original data for each data setStep by Step Solution
There are 3 Steps involved in it
Step: 1

Get Instant Access to Expert-Tailored Solutions
See step-by-step solutions with expert insights and AI powered tools for academic success
Step: 2

Step: 3

Ace Your Homework with AI
Get the answers you need in no time with our AI-driven, step-by-step assistance
Get Started


