

Question
You are analyzing the leverage of two firms and you note the following (all values in millions of dollars): (4 points) a. What is the
You are analyzing the leverage of two firms and you note the following (all values in millions of dollars): (4 points)
a. What is the market debt-to-equity ratio of each firm?
b. What is the book debt-to-equity ratio of each firm?
c. What is the interest coverage ratio of each firm?
d. Which firm may have more difficulty meeting its debt obligations? Explain.
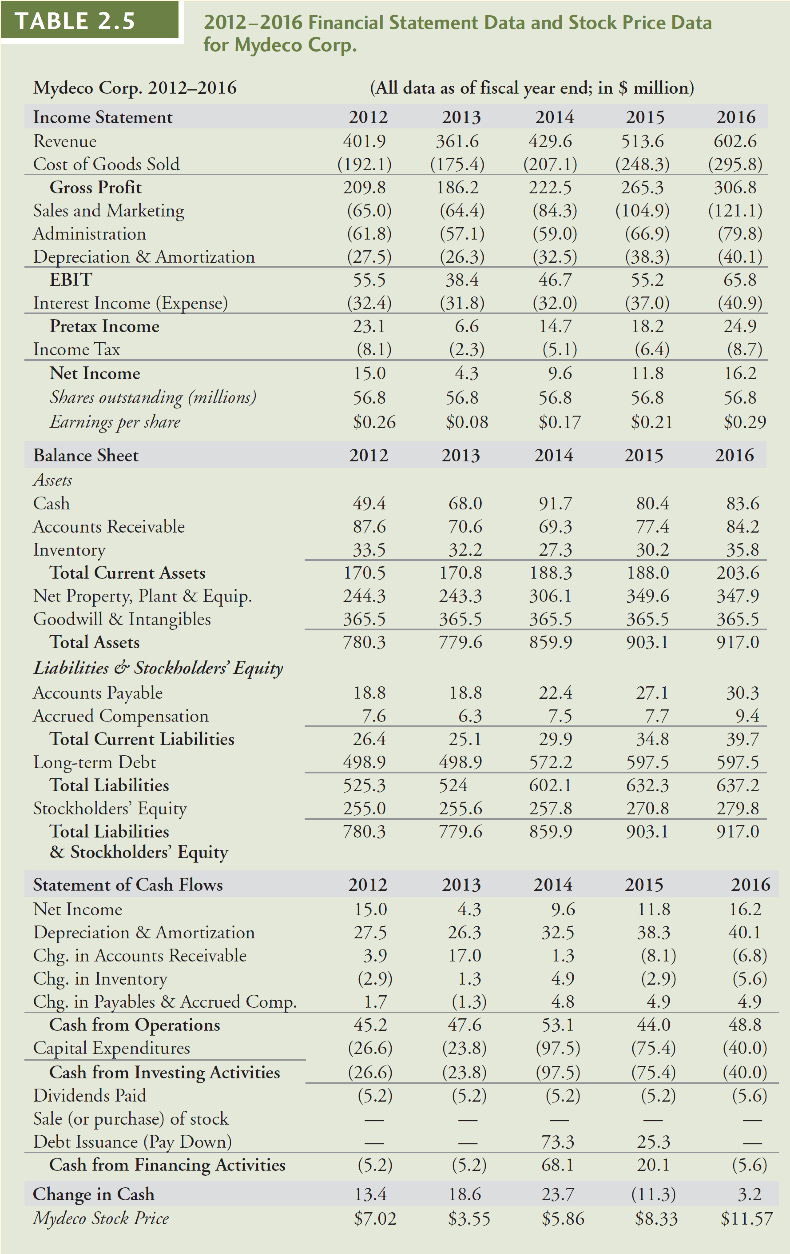
TABLE 2.5 2012-2016 Financial Statement Data and Stock Price Data for Mydeco Corp. (All data as of fiscal year end; in $ million) 2012 2013 2014 2015 401.9 361.6 429.6 513.6 (192.1) (175.4) (207.1) (248.3) 209.8 186.2 222.5 265.3 (65.0) (64.4) (84.3) (104.9) (61.8) (57.1) (59.0) (66.9) (27.5) (26.3) (32.5) (38.3) 55.5 38.4 46.7 55.2 (32.4) (31.8) (32.0) (37.0) 23.1 6.6 14.7 18.2 (8.1) (2.3) (5.1) (6.4) 15.0 4.3 9.6 11.8 56.8 56.8 56.8 56.8 $0.26 $0.08 $0.17 $0.21 2016 602.6 (295.8) 306.8 (121.1) (79.8) (40.1) 65.8 (40.9) 24.9 (8.7) 16.2 56.8 $0.29 2012 2013 2014 2015 2016 83.6 84.2 35.8 49.4 87.6 33.5 170.5 244.3 365.5 780.3 68.0 70.6 32.2 170.8 243.3 365.5 779.6 91.7 69.3 27.3 188.3 306.1 365.5 859.9 80.4 77.4 30.2 188.0 349.6 365.5 903.1 203.6 347.9 365.5 917.0 Mydeco Corp. 20122016 Income Statement Revenue Cost of Goods Sold Gross Profit Sales and Marketing Administration Depreciation & Amortization EBIT Interest Income (Expense) Pretax Income Income Tax Net Income Shares outstanding (millions) Earnings per share Balance Sheet Assets Cash Accounts Receivable Inventory Total Current Assets Net Property, Plant & Equip. Goodwill & Intangibles Total Assets Liabilities & Stockholders' Equity Accounts Payable Accrued Compensation Total Current Liabilities Long-term Debt Total Liabilities Stockholders' Equity Total Liabilities & Stockholders' Equity Statement of Cash Flows Net Income Depreciation & Amortization Chg. in Accounts Receivable Chg. in Inventory Chg. in Payables & Accrued Comp. Cash from Operations Capital Expenditures Cash from Investing Activities Dividends Paid Sale (or purchase) of stock Debt Issuance (Pay Down) Cash from Financing Activities Change in Cash Mydeco Stock Price 18.8 18.8 27.1 7.6 26.4 498.9 525.3 255.0 780.3 6.3 25.1 498.9 524 255.6 22.4 7.5 29.9 572.2 602.1 257.8 859.9 7.7 34.8 597.5 632.3 270.8 903.1 30.3 9.4 39.7 597.5 637.2 279.8 917.0 779.6 2012 15.0 27.5 3.9 (2.9) 1.7 45.2 (26.6) (26.6) (5.2) 2013 4.3 26.3 17.0 1.3 (1.3) 47.6 (23.8) (23.8) (5.2) 2014 9.6 32.5 1.3 4.9 4.8 53.1 (97.5) (97.5) (5.2) 2015 11.8 38.3 (8.1) (2.9) 4.9 44.0 (75.4) (75.4) (5.2) 2016 16.2 40.1 (6.8) (5.6) 4.9 48.8 (40.0) (40.0) (5.6) 73.3 68.1 25.3 20.1 (5.2) 13.4 $7.02 (5.2) 18.6 $3.55 23.7 $5.86 (11.3) $8.33 (5.6) 3.2 $11.57 TABLE 2.5 2012-2016 Financial Statement Data and Stock Price Data for Mydeco Corp. (All data as of fiscal year end; in $ million) 2012 2013 2014 2015 401.9 361.6 429.6 513.6 (192.1) (175.4) (207.1) (248.3) 209.8 186.2 222.5 265.3 (65.0) (64.4) (84.3) (104.9) (61.8) (57.1) (59.0) (66.9) (27.5) (26.3) (32.5) (38.3) 55.5 38.4 46.7 55.2 (32.4) (31.8) (32.0) (37.0) 23.1 6.6 14.7 18.2 (8.1) (2.3) (5.1) (6.4) 15.0 4.3 9.6 11.8 56.8 56.8 56.8 56.8 $0.26 $0.08 $0.17 $0.21 2016 602.6 (295.8) 306.8 (121.1) (79.8) (40.1) 65.8 (40.9) 24.9 (8.7) 16.2 56.8 $0.29 2012 2013 2014 2015 2016 83.6 84.2 35.8 49.4 87.6 33.5 170.5 244.3 365.5 780.3 68.0 70.6 32.2 170.8 243.3 365.5 779.6 91.7 69.3 27.3 188.3 306.1 365.5 859.9 80.4 77.4 30.2 188.0 349.6 365.5 903.1 203.6 347.9 365.5 917.0 Mydeco Corp. 20122016 Income Statement Revenue Cost of Goods Sold Gross Profit Sales and Marketing Administration Depreciation & Amortization EBIT Interest Income (Expense) Pretax Income Income Tax Net Income Shares outstanding (millions) Earnings per share Balance Sheet Assets Cash Accounts Receivable Inventory Total Current Assets Net Property, Plant & Equip. Goodwill & Intangibles Total Assets Liabilities & Stockholders' Equity Accounts Payable Accrued Compensation Total Current Liabilities Long-term Debt Total Liabilities Stockholders' Equity Total Liabilities & Stockholders' Equity Statement of Cash Flows Net Income Depreciation & Amortization Chg. in Accounts Receivable Chg. in Inventory Chg. in Payables & Accrued Comp. Cash from Operations Capital Expenditures Cash from Investing Activities Dividends Paid Sale (or purchase) of stock Debt Issuance (Pay Down) Cash from Financing Activities Change in Cash Mydeco Stock Price 18.8 18.8 27.1 7.6 26.4 498.9 525.3 255.0 780.3 6.3 25.1 498.9 524 255.6 22.4 7.5 29.9 572.2 602.1 257.8 859.9 7.7 34.8 597.5 632.3 270.8 903.1 30.3 9.4 39.7 597.5 637.2 279.8 917.0 779.6 2012 15.0 27.5 3.9 (2.9) 1.7 45.2 (26.6) (26.6) (5.2) 2013 4.3 26.3 17.0 1.3 (1.3) 47.6 (23.8) (23.8) (5.2) 2014 9.6 32.5 1.3 4.9 4.8 53.1 (97.5) (97.5) (5.2) 2015 11.8 38.3 (8.1) (2.9) 4.9 44.0 (75.4) (75.4) (5.2) 2016 16.2 40.1 (6.8) (5.6) 4.9 48.8 (40.0) (40.0) (5.6) 73.3 68.1 25.3 20.1 (5.2) 13.4 $7.02 (5.2) 18.6 $3.55 23.7 $5.86 (11.3) $8.33 (5.6) 3.2 $11.57Step by Step Solution
There are 3 Steps involved in it
Step: 1

Get Instant Access to Expert-Tailored Solutions
See step-by-step solutions with expert insights and AI powered tools for academic success
Step: 2

Step: 3
Ace Your Homework with AI
Get the answers you need in no time with our AI-driven, step-by-step assistance
Get Started
Financial Management Core Concepts
Authors: Ray Brooks, Raymond Brooks
1st Edition
0321155173, 9780321155177