- You are the manager of Short Term Capital Management (STCM). You observe that the interest rate on 4 year notes is 5.2 percent, while the interest rate 4.25 year notes is 5.29 percent. You know for sure for sure that the two interest rates will converge in six months to some value X. You also have the ability to go short $300 million face in any note you choose. Given all this, describe your profit making arbitrage strategy. Then graph the amount of money you will make if the interest rate converges to X, X a percentage rate between 3 and 7 percent. Please make sure you dont have negative returns.
Note: If your initial calculations show a negative return, you can simply reverse the strategy.
Graph 50 data points for the interest rate using EXCEL (please display the formulas used once you're done). For example, graph for interest rates would be between 3% and 7% with atleast 50 data points ( Ex 3.00%, 3.10%, 3.20%...., 6.90%, 7.00%, etc) Here's EXAMPLE on what it should look like when completed:
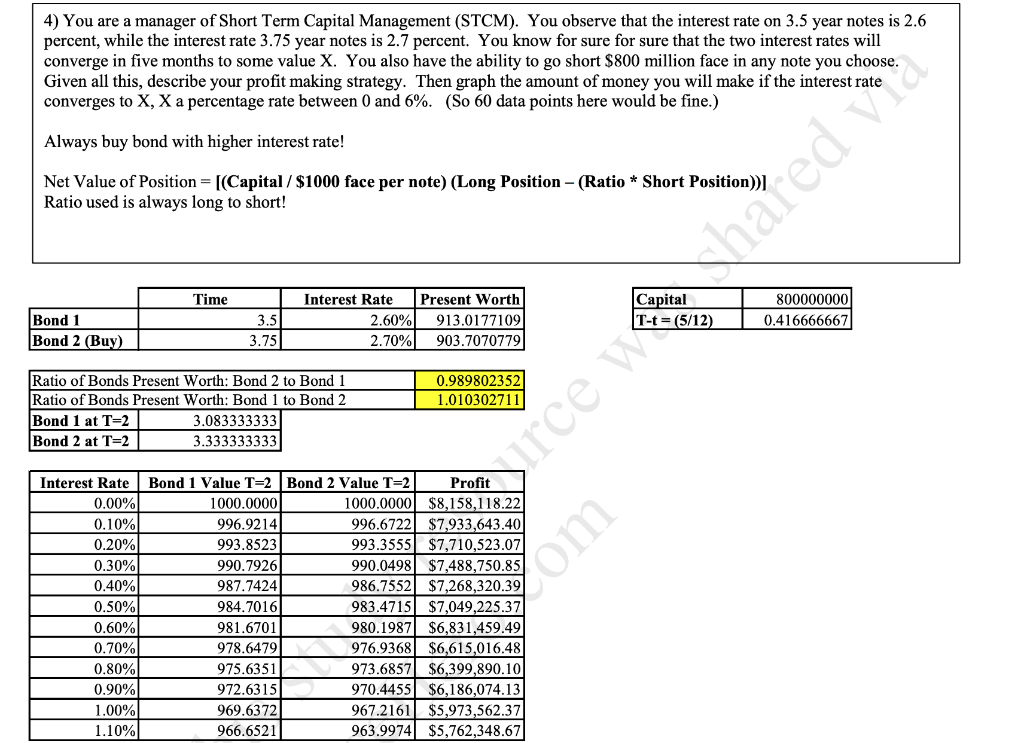
4) You are a manager of Short Term Capital Management (STCM). You observe that the interest rate on 3.5 year notes is 2.6 percent, while the interest rate 3.75 year notes is 2.7 percent. You know for sure for sure that the two interest rates will converge in five months to some value X. You also have the ability to go short $800 million face in any note you choose. Given all this, describe your profit making strategy. Then graph the amount of money you will make if the interest rate converges to X, X a percentage rate between 0 and 6%. (So 60 data points here would be fine.) Always buy bond with higher interest rate! Net Value of Position = [(Capital / $1000 face per note) (Long Position - (Ratio * Short Position) Ratio used is always long to short! Time Bond 1 Bond 2 (Buy) Interest Rate 2.60% 2.70% 800000000 0.416666667 3.5 3.75 Present Worth 913.0177109 903.7070779 0.989802352 1.010302711 Ratio of Bonds Present Worth: Bond 2 to Bond 1 Ratio of Bonds Present Worth: Bond 1 to Bond 2 Bond 1 at T=2 3.083333333 Bond 2 at T=2 3.333333333 orce d'ed Interest Rate 0.00% 0.10% 0.20% 0.30% 0.40% 0.50% 0.60% 0.70% 0.80% 0.90% 1.00% 1.10% Bond 1 Value T=2 Bond 2 Value T=2 1000.0000 1000.0000 996.9214 993.8523 993.3555 990.7926 990.0498 $7,488,750.85 987.7424 986.7552 $7,268,320.39 984.7016 983.4715 $7,049,225.37 981.6701 980.1987 $6,831,459.49 978.6479 976.9368 $6,615,016.48 975.6351 973.6857 $6,399,890.10 972.6315 970.4455 $6,186,074.13 969.6372 967.2161 $5,973,562.37 966.6521 963.9974 $5,762,348.67 som 4) You are a manager of Short Term Capital Management (STCM). You observe that the interest rate on 3.5 year notes is 2.6 percent, while the interest rate 3.75 year notes is 2.7 percent. You know for sure for sure that the two interest rates will converge in five months to some value X. You also have the ability to go short $800 million face in any note you choose. Given all this, describe your profit making strategy. Then graph the amount of money you will make if the interest rate converges to X, X a percentage rate between 0 and 6%. (So 60 data points here would be fine.) Always buy bond with higher interest rate! Net Value of Position = [(Capital / $1000 face per note) (Long Position - (Ratio * Short Position) Ratio used is always long to short! Time Bond 1 Bond 2 (Buy) Interest Rate 2.60% 2.70% 800000000 0.416666667 3.5 3.75 Present Worth 913.0177109 903.7070779 0.989802352 1.010302711 Ratio of Bonds Present Worth: Bond 2 to Bond 1 Ratio of Bonds Present Worth: Bond 1 to Bond 2 Bond 1 at T=2 3.083333333 Bond 2 at T=2 3.333333333 orce d'ed Interest Rate 0.00% 0.10% 0.20% 0.30% 0.40% 0.50% 0.60% 0.70% 0.80% 0.90% 1.00% 1.10% Bond 1 Value T=2 Bond 2 Value T=2 1000.0000 1000.0000 996.9214 993.8523 993.3555 990.7926 990.0498 $7,488,750.85 987.7424 986.7552 $7,268,320.39 984.7016 983.4715 $7,049,225.37 981.6701 980.1987 $6,831,459.49 978.6479 976.9368 $6,615,016.48 975.6351 973.6857 $6,399,890.10 972.6315 970.4455 $6,186,074.13 969.6372 967.2161 $5,973,562.37 966.6521 963.9974 $5,762,348.67 som