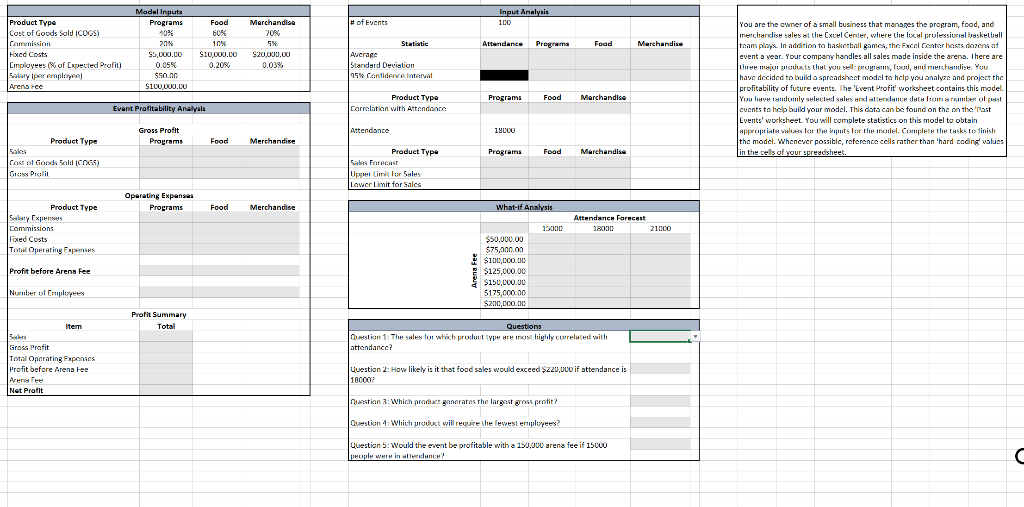
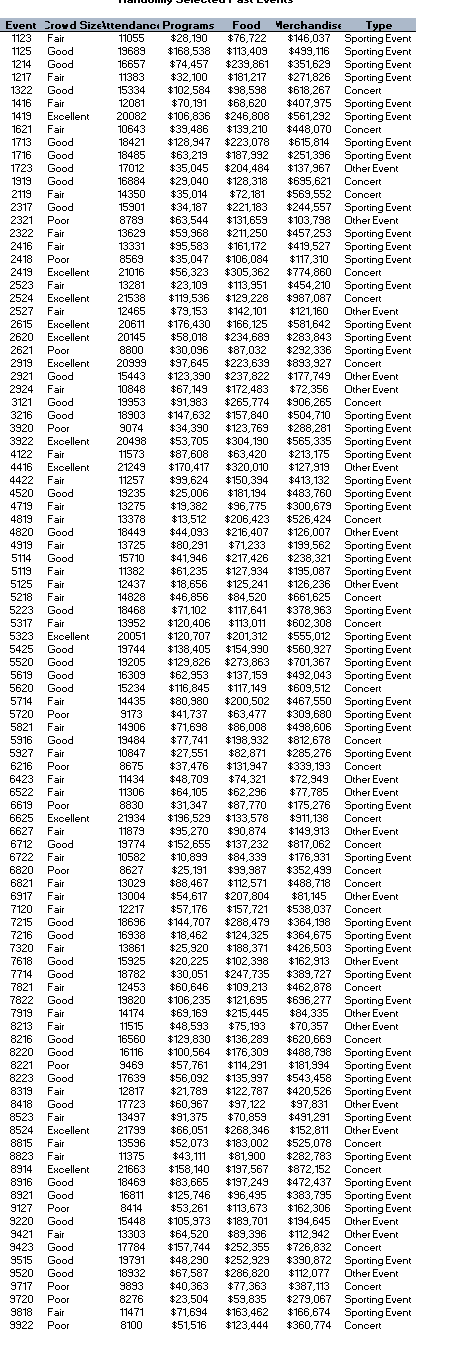
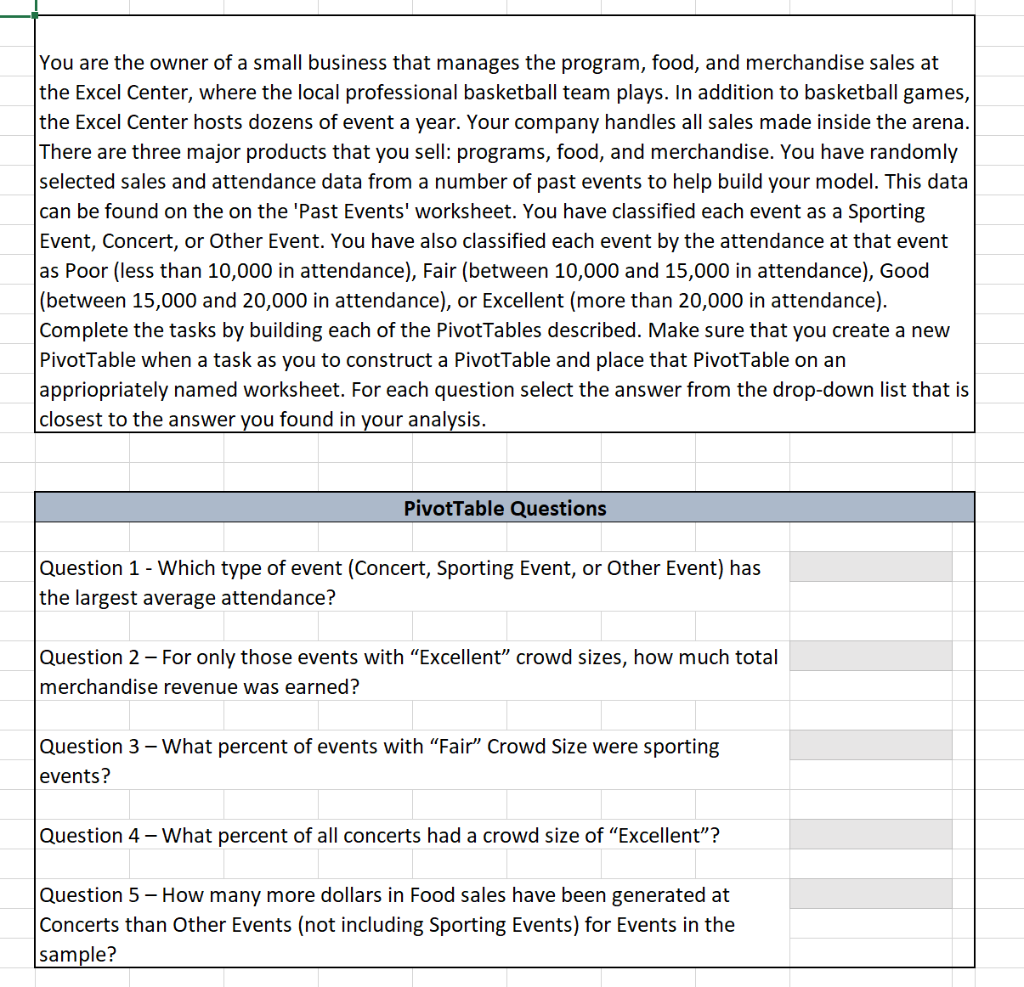
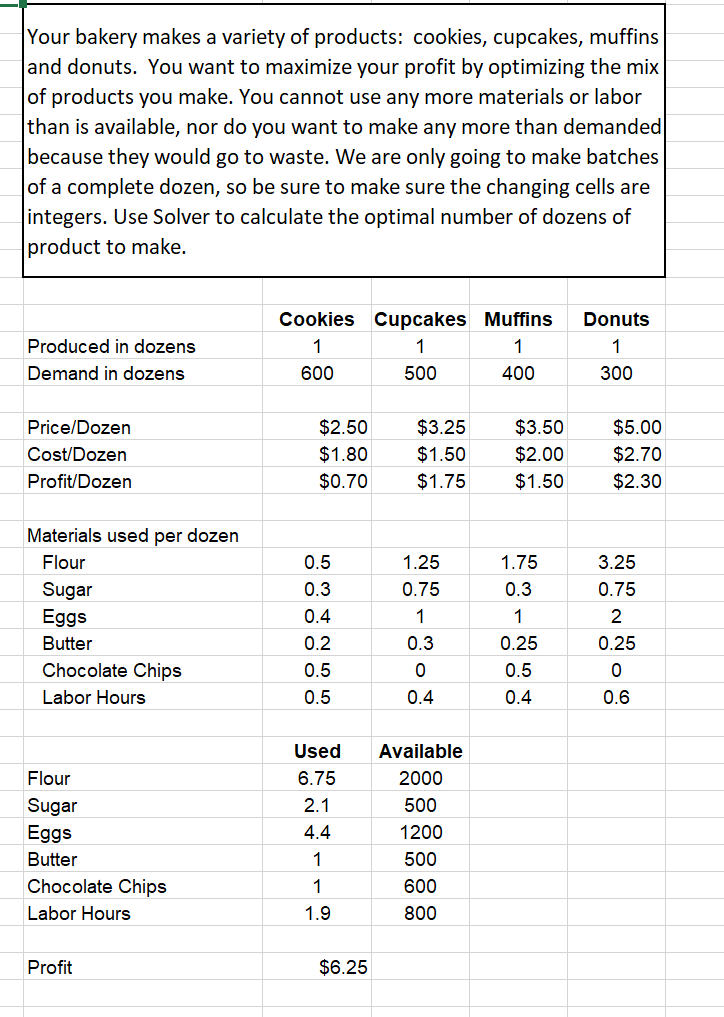
You are the ovmer of a small business that manayes the program, food, and irenchardise syles al the Cxvel Cenler, where lie lexal prolersiarial bysketbull toan plaps. In addition to haskretall games, the Fecol fonter hosts rionche of event a vear. Your compary handles all sales made inside the arena. I here are have decided to build a sprcadslocet modcl to help you analyze and projact the profitatility' of future events. The 'Event Profit' worksheet contains this model. cucnts to hap buid your model. This dots can be found on the on the 'Pant Events' workshest. You will complete statistics on this model to obtain the model. Whencecr possiblc, rcforence cells rather than 'hard cacing valucs in the cels of your spreadsheet. T M You are the owner of a small business that manages the program, food, and merchandise sales at the Excel Center, where the local professional basketball team plays. In addition to basketball games, the Excel Center hosts dozens of event a year. Your company handles all sales made inside the arena. There are three major products that you sell: programs, food, and merchandise. You have randomly selected sales and attendance data from a number of past events to help build your model. This data can be found on the on the 'Past Events' worksheet. You have classified each event as a Sporting Event, Concert, or Other Event. You have also classified each event by the attendance at that event as Poor (less than 10,000 in attendance), Fair (between 10,000 and 15,000 in attendance), Good (between 15,000 and 20,000 in attendance), or Excellent (more than 20,000 in attendance). Complete the tasks by building each of the PivotTables described. Make sure that you create a new PivotTable when a task as you to construct a PivotTable and place that PivotTable on an appriopriately named worksheet. For each question select the answer from the drop-down list that is closest to the answer you found in your analysis. PivotTable Questions Question 1 - Which type of event (Concert, Sporting Event, or Other Event) has the largest average attendance? Question 2 - For only those events with "Excellent" crowd sizes, how much total merchandise revenue was earned? Question 3 - What percent of events with "Fair" Crowd Size were sporting events? Question 4 - What percent of all concerts had a crowd size of "Excellent"? Question 5 - How many more dollars in Food sales have been generated at Concerts than Other Events (not including Sporting Events) for Events in the sample? Your bakery makes a variety of products: cookies, cupcakes, muffins and donuts. You want to maximize your profit by optimizing the mix of products you make. You cannot use any more materials or labor than is available, nor do you want to make any more than demanded because they would go to waste. We are only going to make batches of a complete dozen, so be sure to make sure the changing cells are integers. Use Solver to calculate the optimal number of dozens of product to make. You are the ovmer of a small business that manayes the program, food, and irenchardise syles al the Cxvel Cenler, where lie lexal prolersiarial bysketbull toan plaps. In addition to haskretall games, the Fecol fonter hosts rionche of event a vear. Your compary handles all sales made inside the arena. I here are have decided to build a sprcadslocet modcl to help you analyze and projact the profitatility' of future events. The 'Event Profit' worksheet contains this model. cucnts to hap buid your model. This dots can be found on the on the 'Pant Events' workshest. You will complete statistics on this model to obtain the model. Whencecr possiblc, rcforence cells rather than 'hard cacing valucs in the cels of your spreadsheet. T M You are the owner of a small business that manages the program, food, and merchandise sales at the Excel Center, where the local professional basketball team plays. In addition to basketball games, the Excel Center hosts dozens of event a year. Your company handles all sales made inside the arena. There are three major products that you sell: programs, food, and merchandise. You have randomly selected sales and attendance data from a number of past events to help build your model. This data can be found on the on the 'Past Events' worksheet. You have classified each event as a Sporting Event, Concert, or Other Event. You have also classified each event by the attendance at that event as Poor (less than 10,000 in attendance), Fair (between 10,000 and 15,000 in attendance), Good (between 15,000 and 20,000 in attendance), or Excellent (more than 20,000 in attendance). Complete the tasks by building each of the PivotTables described. Make sure that you create a new PivotTable when a task as you to construct a PivotTable and place that PivotTable on an appriopriately named worksheet. For each question select the answer from the drop-down list that is closest to the answer you found in your analysis. PivotTable Questions Question 1 - Which type of event (Concert, Sporting Event, or Other Event) has the largest average attendance? Question 2 - For only those events with "Excellent" crowd sizes, how much total merchandise revenue was earned? Question 3 - What percent of events with "Fair" Crowd Size were sporting events? Question 4 - What percent of all concerts had a crowd size of "Excellent"? Question 5 - How many more dollars in Food sales have been generated at Concerts than Other Events (not including Sporting Events) for Events in the sample? Your bakery makes a variety of products: cookies, cupcakes, muffins and donuts. You want to maximize your profit by optimizing the mix of products you make. You cannot use any more materials or labor than is available, nor do you want to make any more than demanded because they would go to waste. We are only going to make batches of a complete dozen, so be sure to make sure the changing cells are integers. Use Solver to calculate the optimal number of dozens of product to make