

Question: You may use the mlp.py model provided although this is not mandatory. This exercise deals with the approximation of functions by neural networks. The so
You may use the mlp.py model provided although this is not mandatory. This exercise deals with the approximation of functions by neural networks. The so called function approximation (regression), is to find a mapping f' satisfying || f'(x) - f(x) ||Preparation of data For this function approximation problem, three kinds of data sets are prepared, namely the training set, the validation set and the test set. The training set is a set of value pairs which comprise information about the target function for training the network. The validation set is associated with the early stopping technique, described below. During the training phase, the validation error is monitored in order to prevent the network from overfitting the training data. Normally, the test set is just used to evaluate the network performance afterwards. But, in this exercise the root mean-square error (rmse) on the test set is used as the performance goal of the network training. For the current problem, the training and the test data are taken from uniform grids (10x10 pairs of values for the training data, 9x9 pairs for the test data). As shown in Fig.1 the range of the function output is already within the interval [-1 1]. So, it is not necessary to scale the target function. For the validation data, in order to make it a better representation of the original function, it is taken randomly from the function surface. Network Design Theoretical results indicate that given enough hidden (non-linear) units, a feedforward neural network can approximate any non-linear functions (with a finite number of discontinuities) to a required degree of accuracy. In other words, any non-linear function can be expressed as a linear combination of non-linear basis functions. Therefore, a two-layer feedforward neural network with 2 layers: one layer of non-linear hidden neurons and one linear output neuron seems a reasonable design for a function approximation task. The target function as defined above has two inputs (x, y), and one output (z = f(x,y)). Thus, as shown in Fig.2, the network solution consists of two inputs, one layer of sigmoid transfer (aka activation) function neurons and one linear transfer function output neuron. You may also want to consider using the hyperbolic tangent activation function for the hidden layer. The number of the hidden neurons is an important design issue. On the one hand, having more hidden neurons allows the network to approximate functions of greater complexity. But, as a result of network's high degree of freedom, it may overfit the training data while the unseen data will be poorly fit to the desired function. On the other hand, although a small network won't have enough power to overfit the training data, it may be too small to adequately represent the target function. In order to choose a reasonable amount of hidden neurons, three different networks with 2, 8 and 50 hidden neurons are examined. The training result (see Fig.3) shows the network with 8 hidden neurons outperforms the other two networks after they are trained with the same training parameters. Here, the number of epochs to convergence will generally vary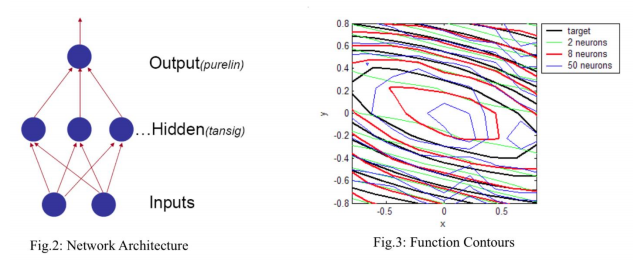
Part (a). You must:
1. Using the GradientDescentOptimizer, investigate the converged performance of a 2 layer neural network with 2, 8 and 50 hidden layer neurons.
2. You must produce a contour diagram similar to Fig.3.
3. Include a table of MSE for the 3 different network sizes and number of epochs to convergence. 4. Indicate whether sigmoid or hyperbolic tangent activation functions were used in your experiments
Im very new to neural networks and don't know how to approach the question.
Thank you for your help
f(x,y) = cos(x + 6*0.35y) + 2*0.35xy x,y E[-1 1] Target Function Surface Target Function Contour -0.2- -0.4- -5.5511e-017 02 over 0.5 -0.6 0.5 0.4 -0.6 0 Z 0.6 gu -0.5 0.4 0.2 -0.5 -0.2 -5.5511e-012-02 -0.6 0.4 0.2 0.5 -1 -1 X -0.5 0 Fig. 1: Parametric surface and contour of the target function 0.8 0.6 target 2 neurons 8 neurons 50 neurons Output(purelin) 04 02 0 ...Hidden(tansig) -0.2 -0.4 -0.6 Inputs -0.8 -0.5 0.5 Fig. 2: Network Architecture Fig.3: Function Contours
Step by Step Solution
There are 3 Steps involved in it

Get step-by-step solutions from verified subject matter experts