

Data for the year 2010 for 10 countries are shown in the table below. Population is in
Question:
Data for the year 2010 for 10 countries are shown in the table below.
Population is in millions of people; debt and GDP is measured in trillions of U.S. dollars.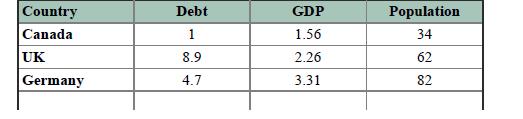
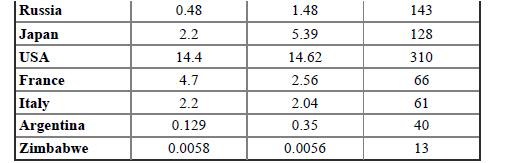
Population data from http://www.census.gov/ipc/www/idb/. GDP and debt data from http://en.wikipedia.org/wiki/List_of_countries_by_GDP_(nominal)
Enter the data in your preferred software. Create another variable by calculating the percentage each country's debt is of its GDP. Create still another variable consisting of debt per capita. Keep in mind debt is measured in units of trillions of dollars and population in units of millions.
Then:
a. Determine and interpret correlation coefficients for all pairs of variables. Which variables show positive correlations and which show negative? How would you interpret the positive correlations? How do you interpret the negative correlations? Do the values and their signs make sense? Comment on the results.
b. Estimate the regression equation for debt using population as the explanatory variable.
c. By how much does debt change as GDP changes? This requires a regression model. Which is the dependent variable? Run the regression and interpret the results.
d. What happens to debt as GDP increases? Provide an economic rationale for that.
e. Discuss any economic rationale for the relationship between GDP and debt as a percentage of GDP.
f. Do more heavily populated countries have higher per capita debt?
Explain. Provide your economic rationale for this phenomenon.
Step by Step Answer:


Introductory Regression Analysis With Computer Application For Business And Economics
ISBN: 9780415899338
1st Edition
Authors: Allen Webster
