

13.44 Quality and productivity The table shows data from 27 automotive plants on y = number of...
Question:
13.44 Quality and productivity The table shows data from 27 automotive plants on y = number of assembly defects per 100 cars and x = time (in hours) to assemble each vehicle.
The data are in the Quality and Productivity file on the book’s website.
Regression of selling price of house in thousands versus house size and condition Term Coef SE Coef T-Value P-Value Constant 96.27 13.46 7.15 0.000 House Size 0.066463 0.004682 14.20 0.000 Condition 12.93 17.20 0.75 0.453 S = 81.7874 R-Sq = 50.6%
a. Report the regression equation. Find and interpret the separate lines relating predicted selling price to house size for good condition homes and for homes in not good condition.
b. Sketch how selling price varies as a function of house size for homes in good condition and for homes in not good condition.
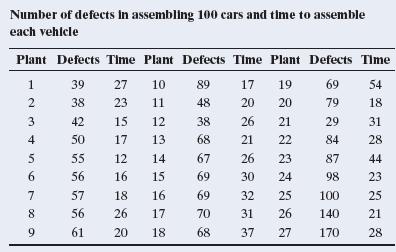
a. The prediction equation is yn = 61.3 + 0.35x. Find the predicted number of defects for a car having assembly time (i) 12 hours (the minimum) and (ii) 54 hours (the maximum).
b. The first 11 plants were Japanese facilities and the rest were not. Let x1 = time to assemble vehicle and x2 = whether facility is Japanese 11 = yes, 0 = no2.
The fit of the multiple regression model is yn = 105.0 - 0.78x1 - 36.0x2. Interpret the coefficients that estimate the effect of x1 and the effect of x2.
c. Explain why part a and part b indicate that Simpson’s paradox has occurred.
d. Explain how Simpson’s paradox occurred. To do this, construct a scatterplot between y and x1 in which points are identified by whether the facility is Japanese.
Note that the Japanese facilities tended to have low values for both x1 and x2.
Step by Step Answer:

This question has not been answered yet.
You can Ask your question!


Statistics The Art And Science Of Learning From Data
ISBN: 9781292164878
4th Global Edition
Authors: Alan Agresti, Christine A. Franklin, Bernhard Klingenberg
