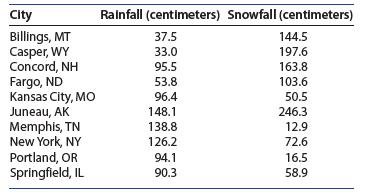
14. Rain and Snow The following table shows the average annual rainfall (centimeters) and the average annual
Question:
14. Rain and Snow The following table shows the average annual rainfall (centimeters) and the average annual snowfall (centimeters) for 10 cities in the United States

a. Construct a scatterplot for the data.
b. Calculate the correlation coefficient r. Describe the form, direction, and strength of the relationship between rainfall and snowfall.
c. Are there any outliers in the scatterplot? If so, which city does this outlier represent?
d. Remove the outlier that you found in part c from the data set and recalculate the correlation coefficient r for the remaining nine cities. Does the correlation between rainfall and snowfall change, and, if so, in what way?
Step by Step Answer:

Introduction To Probability And Statistics
ISBN: 9780357114469
15th Edition
Authors: William Mendenhall Iii , Robert Beaver , Barbara Beaver


