

Critical Thinking: Boxplots and Confidence Intervals The distribution of heights of 18-year-old men in the United States
Question:
Critical Thinking: Boxplots and Confidence Intervals The distribution of heights of 18-year-old men in the United States is approximately normal, with mean 68 inches and standard deviation 3 inches
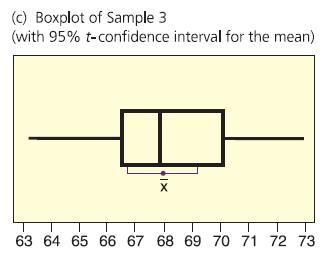
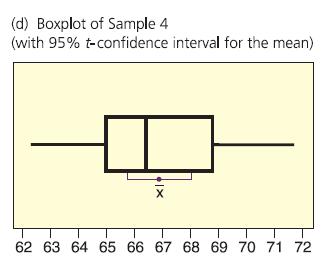
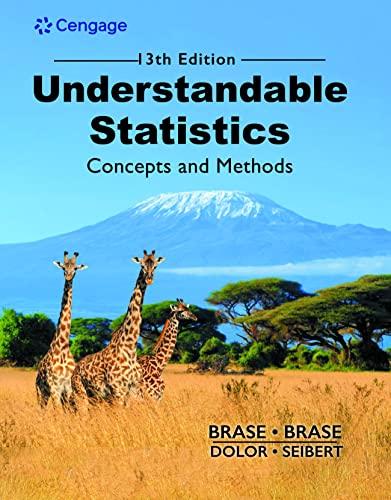
(U.S. Census Bureau). In Minitab, we can simulate the drawing of random samples of size 20 from this population (➤ Calc ➤ Random Data ➤ Normal, with 20 rows from a distribution with mean 68 and standard deviation 3). Then we can have Minitab compute a 95% confidence interval and draw a boxplot of the data (➤ Stat ➤ Basic Statistics ➤ 1—Sample t, with boxplot selected in the graphs). The boxplots and confidence intervals for four different samples are shown in the accompanying figures. The four confidence intervals are VARIABLE N MEAN STDEV SEMEAN 95.0 % CI Sample 1 20 68.050 2.901 0.649 (66.692, 69.407)
Sample 2 20 67.958 3.137 0.702 (66.490, 69.426)
Sample 3 20 67.976 2.639 0.590 (66.741, 69.211)
Sample 4 20 66.908 2.440 0.546 (65.766, 68.050)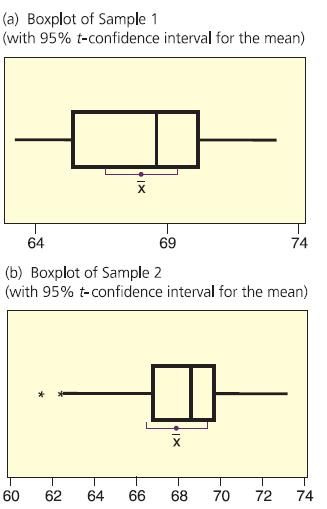
(a) Examine the figure [parts
(a) to (d)]. How do the boxplots for the four samples differ? Why should you expect the boxplots to differ?
(b) Examine the 95% confidence intervals for the four samples shown in the printout. Do the intervals differ in length? Do the intervals all contain the expected population mean of 68 inches? If we draw more samples, do you expect all of the resulting 95% confidence intervals to contain m 5 68? Why or why not?AppendixLO1
Step by Step Answer:

This question has not been answered yet.
You can Ask your question!

Understandable Statistics Concepts And Methods
ISBN: 9780357719176
13th Edition
Authors: Charles Henry Brase, Corrinne Pellillo Brase
