

Each of 300 volunteers collected a random sample of 500 adult voters and recorded the proportion that
Question:
Each of 300 volunteers collected a random sample of 500 adult voters and recorded the proportion that were in favor of a particular new constitutional amendment.
The proportions in the 300 samples are summarized in the following frequency table.
Range Frequency 0.33 - 0.35 3 0.35 - 0.37 22 0.37 - 0.39 60 0.39 - 0.41 101 0.41 - 0.43 82 0.43 - 0.45 27 0.45 - 0.47 5.
The five number summary of the 300 sample proportions was found to be: min 5 0.336 5 0.385 median 1 Q min 5 0.336 5 0.385 median 5 0.4025 5 0.416 max 5 0.464 1 3 Q Q The three smallest values were 0.336, 0.340, and 0.340. The three largest values were 0.460, 0.640, and 0.646. The mean of the 300 sample proportions was 0.4012 with a standard deviation of 0.0231.
(a) Sketch a histogram based on the frequency table.
Does it appear to be roughly symmetric and mound-shaped?
(b) Compute the interquartile range, and determine if there are any outliers in the data. (Recall that an outlier is a value above 3 Q by more than 1.5 times the interquartile range, or below 1 Q by more than 1.5 times the interquartile range.)
(c) Compute the Pearson index. Does this indicate that the data is skewed?
(d) What does the following normal quantile plot tell you about the distribution of the sample means?AppendixLO1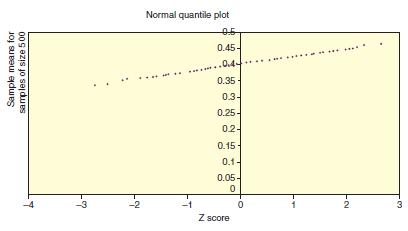
Step by Step Answer:

This question has not been answered yet.
You can Ask your question!

Understandable Statistics Concepts And Methods
ISBN: 9780357719176
13th Edition
Authors: Charles Henry Brase, Corrinne Pellillo Brase
