

Websters Widgets collects random samples of 100 widgets from their widget factory several times per shift and
Question:
Webster’s Widgets collects random samples of 100 widgets from their widget factory several times per shift and records the mean weight of the sample
(in grams). The means of 400 samples are summarized in the following frequency table.
Range Frequency 6.8 – 7.2 21 7.2 – 7.6 73 7.6 – 8.0 103 8.0 – 8.4 108 8.4 – 8.8 76 8.8 – 9.2 15 9.2 – 9.6 4 The five number summary of the 400 sample means was found to be:
min 5 6.885 Q1 5 7.627 median 5 8.012 Q3 5 8.372 max 5 9.523 min 6.885 7.627 median 8.012 8.372 max 9.523 1 3 5 Q 5 5 Q 5 5 The three smallest values were 6.885, 6.905, and 6.934. The three largest values were 9.286, 9.499, and 9.523. The mean of the 400 sample means was 8.0115 with a standard deviation of 0.4915.
(a) Sketch a histogram based on the frequency table.
Does it appear to be roughly symmetric and mound-shaped?
(b) Compute the interquartile range, and determine if there are any outliers in the data. (Recall that an outlier is a value above 3 Q by more than 1.5 times the interquartile range, or below Q1 by more than 1.5 times the interquartile range.)
(c) Compute the Pearson index. Does this indicate that the data is skewed?
(d) What does the following normal quantile plot tell you about the distribution of the sample means?AppendixLO1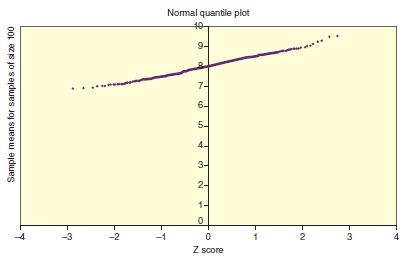
Step by Step Answer:

This question has not been answered yet.
You can Ask your question!

Understandable Statistics Concepts And Methods
ISBN: 9780357719176
13th Edition
Authors: Charles Henry Brase, Corrinne Pellillo Brase
